- what: track and manage all changes and events that can have a business and/or operational impact.
(deploys, manual changes, outages, press releases, etc) - why: to increase operational visibility and collaboration
some use cases:
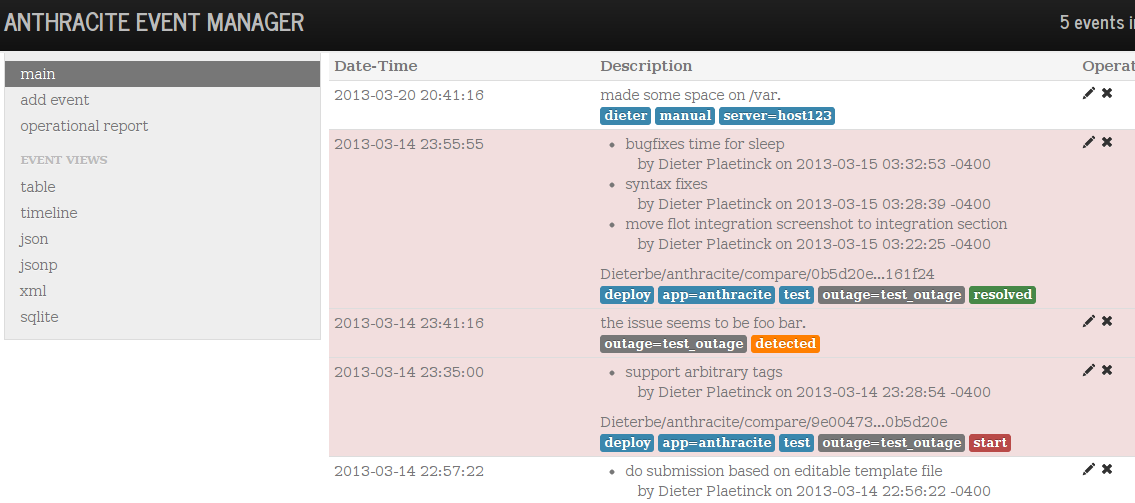
- changelog for troubleshooting and keeping people informed
- enriching monitoring dashboards with markers and annotation text, for visual interactive analysis
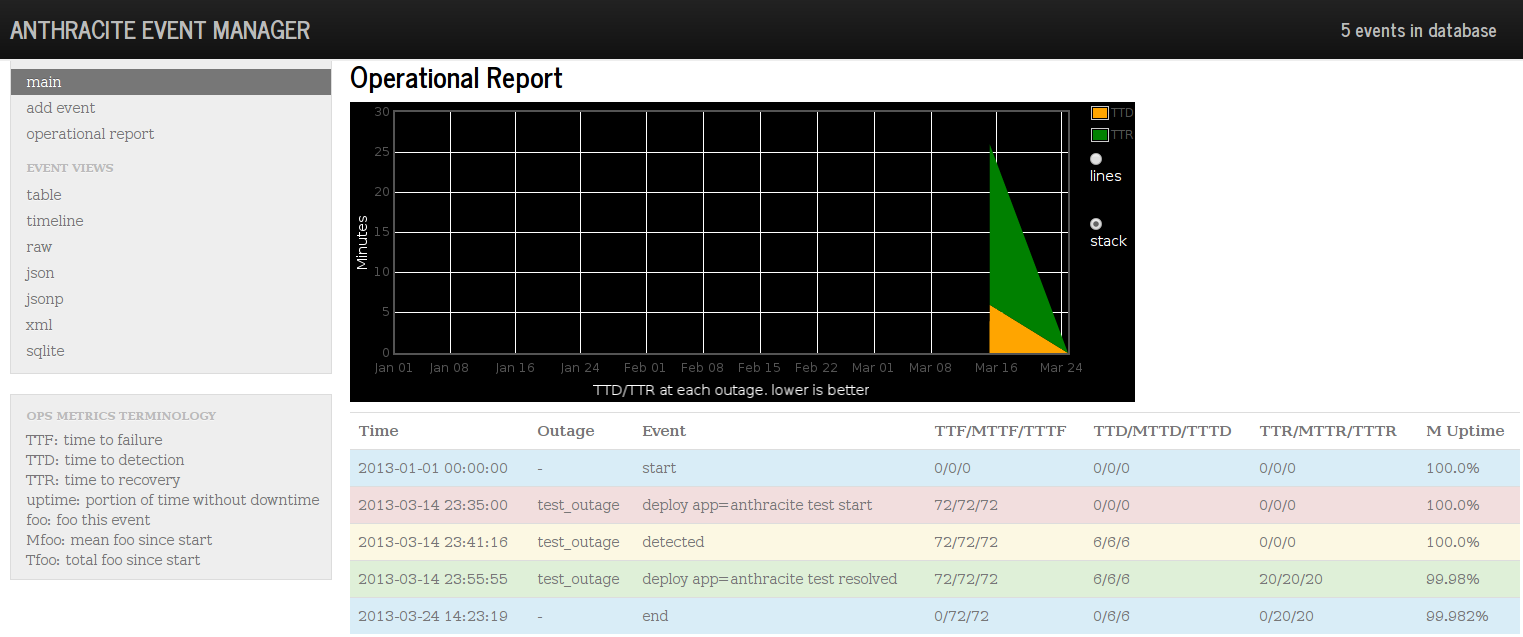
- generating reports of operational outage response metrics (see further down)
- do one thing and do it well. aim for simplicity, flexibility and integration.
- accept and deliver events in various ways and support querying for tags and text (full text search)
- support arbitrary tags, allow events with multiple lines, even rich text and hyperlinks.
- anthracite-web.py is the web app (interface for humans, and HTTP POST event receiver)
- anthracite-compose-submit.sh to interactively compose and submit events from the CLI.
- anthracite-submit-github.sh to send messages with git log from a code checkout
- ElasticSearch is used as database.
- HTTP POST receiver in the web app (so you can use something like curl)
- manually, in the web interface
- manually, with the
anthracite-compose-submit.shCLI script anthracite-submit-github.shgoes into a code checkout, generates a nice message with the commits/author info from a given commit range, and submits it, along with a given list of tags
See the integration-examples directory for shell scripts (which also demonstrate how to use curl) and a python function.
- Timeserieswidget shows graphite graphs with anthracite's events
- The Graph-Explorer graphite dashboard uses that. You can search for events using ES/Lucene's powerfull fulltext search, and you can also add new events by clicking on graphs where anomalies appear.

- python2
- elasticsearch
- java >=1.6 for elasticsearch
standard event has:
- date
- description
- 0-N arbitrary tags (words or 'key=value' tags)
this works fine in a lot of cases, but many environments require enhancements. You can enhance quite a bunch via config.py options. The forms adapt as needed, and the extra fields will be stored like regular fields.
-
recommended_tags: promote the use of specific tags in forms (they still get stored with other tags) -
extra_attributes: extend on the default schema by specifying attributes, with these properties:- key: the field name
- label: label to use in forms
- mandatory: does this option need to be filled in on forms or can it be left blank?
- choices: list of values. or False to enable freeform text input. list with 1 element to enforce a specific value.
- select_many: whether to allow the user to select N of the choices, or just one.
-
helptext: override/add help messages for specific fields in forms -
plugins: enable plugins by filename (should match with what's in thepluginsfolder)
The default config.py demonstrates how to use them.
plugins expose new functionality by providing functions and decorating them with routes to bind them to a http path/method.
They can also add handler functions to handle incoming events (i.e. to validate according to a custom schema)
They provide add_urls to specify which urls should get added to the menu,
remove_urls to denote which existing urls they replace/deprecate.
plugins can have their own template files.
All options mentioned above (except plugins) can be specified by plugins, i.e. you can have plugins
that promote certain tags, change the schema in a certain way, make certain fields mandatory, etc.
Anthracite comes with 2 plugins that we use at Vimeo, and that serve as examples for you:
- vimeo_analytics : tabular and csv outputs for events relevant to our analytics team.
- vimeo_add_forms : specialized forms with different schema's for different teams, and handlers to validate accordingly
empty database/start from scratch (requires anthracite-web restart)
curl -X DELETE "http://localhost:9200/anthracite"
Install dependencies, and just get a code checkout and initialize all git submodules, like so:
git clone --recursive https://github.com/Dieterbe/anthracite.git
- for Elasticsearch:
super easy, see elasticsearch docs
just set a unique cluster name, like <company>-anthracite.
This avoids ES accidentally joining other running ES instances on the same network and forming an undesired replicating cluster.
No need for any further configuration, schema setup, etc, anthracite-web takes care of that.
Start the web application and point your browser to http://0.0.0.0:8081/
<path_to_anthracite>/anthracite-web.py
<path_to_elasticsearch>/bin/elasticsearch
I recommend you submit any event that has or might have a relevant effect on:
- your application behavior
- monitoring itself (for example you fixed a bug in metrics reporting. it shouldn't look like the app behavior changed)
- the business (press coverage, viral videos, etc), because this also affects your app usage and metrics.
The format is very loose. I recommend to use tags for categorisation, and ultimately there'll be full-text search so you don't have to worry too much about formatting or additional tags, as long as the info is within the event.
However, I recommend to try to use some "standardized" nomenclature, such as 'deploy', 'manual' (for manual changes), 'outage', ...
You can use tags like author=<person> but this usually doesn't give any benefit over just tagging <person>.
new: use the optional outage field for a key (in default config) + start/detected/recovered tag
The event format and its tags are very loose. However, you can use specific tags to enable the ops reporting:
- give outage related events an identifier key (
20130225_switch_broke) and tag outage related events likeoutage=<key>. - add tags like
start,detected(issue noticed) andresolvedto mark resolution (actual service restoration). TODO metric for 'cause identified'. - add these tags to existing events (such as code deploys) or create new events to mark the points in time where an outage started, got detected, got resolved, or changed impact level (i.e. temporary partial fixes)
- Optional: add a tag like
impact=50: scale of 0 to 100 to denote the extent to which users are affected during the outage. (100 being full outage for all) this helps in assessing the severity of the event but don't obsess over it, it doesn't need to be too accurate. note: nothing stops you from using a value like 1000 to mark an unrecoverable loss (i.e. dataloss)
The report will look for these tags and give you a report of your operational metrics: (note that the metrics are not weighted for impact yet)
per event, mean, and total:
- TTF (time to failure)
- TTD (time to detection)
- TTR (time to resolution)
average (TODO per-year)
- Uptime
The ops metametrics slidedeck give you more information.
- plugins for puppet, chef to automatically submit their relevant events (or logstash filter to create anthracite events from logs)
- auto-update events on web interface to make semi-realtime
- on graphs in dashboards, show timeframs from start to end, and start to "cause found", to "resolved" etc.
- concurrent webserver to make sure all http requests can get served
- better MTBF