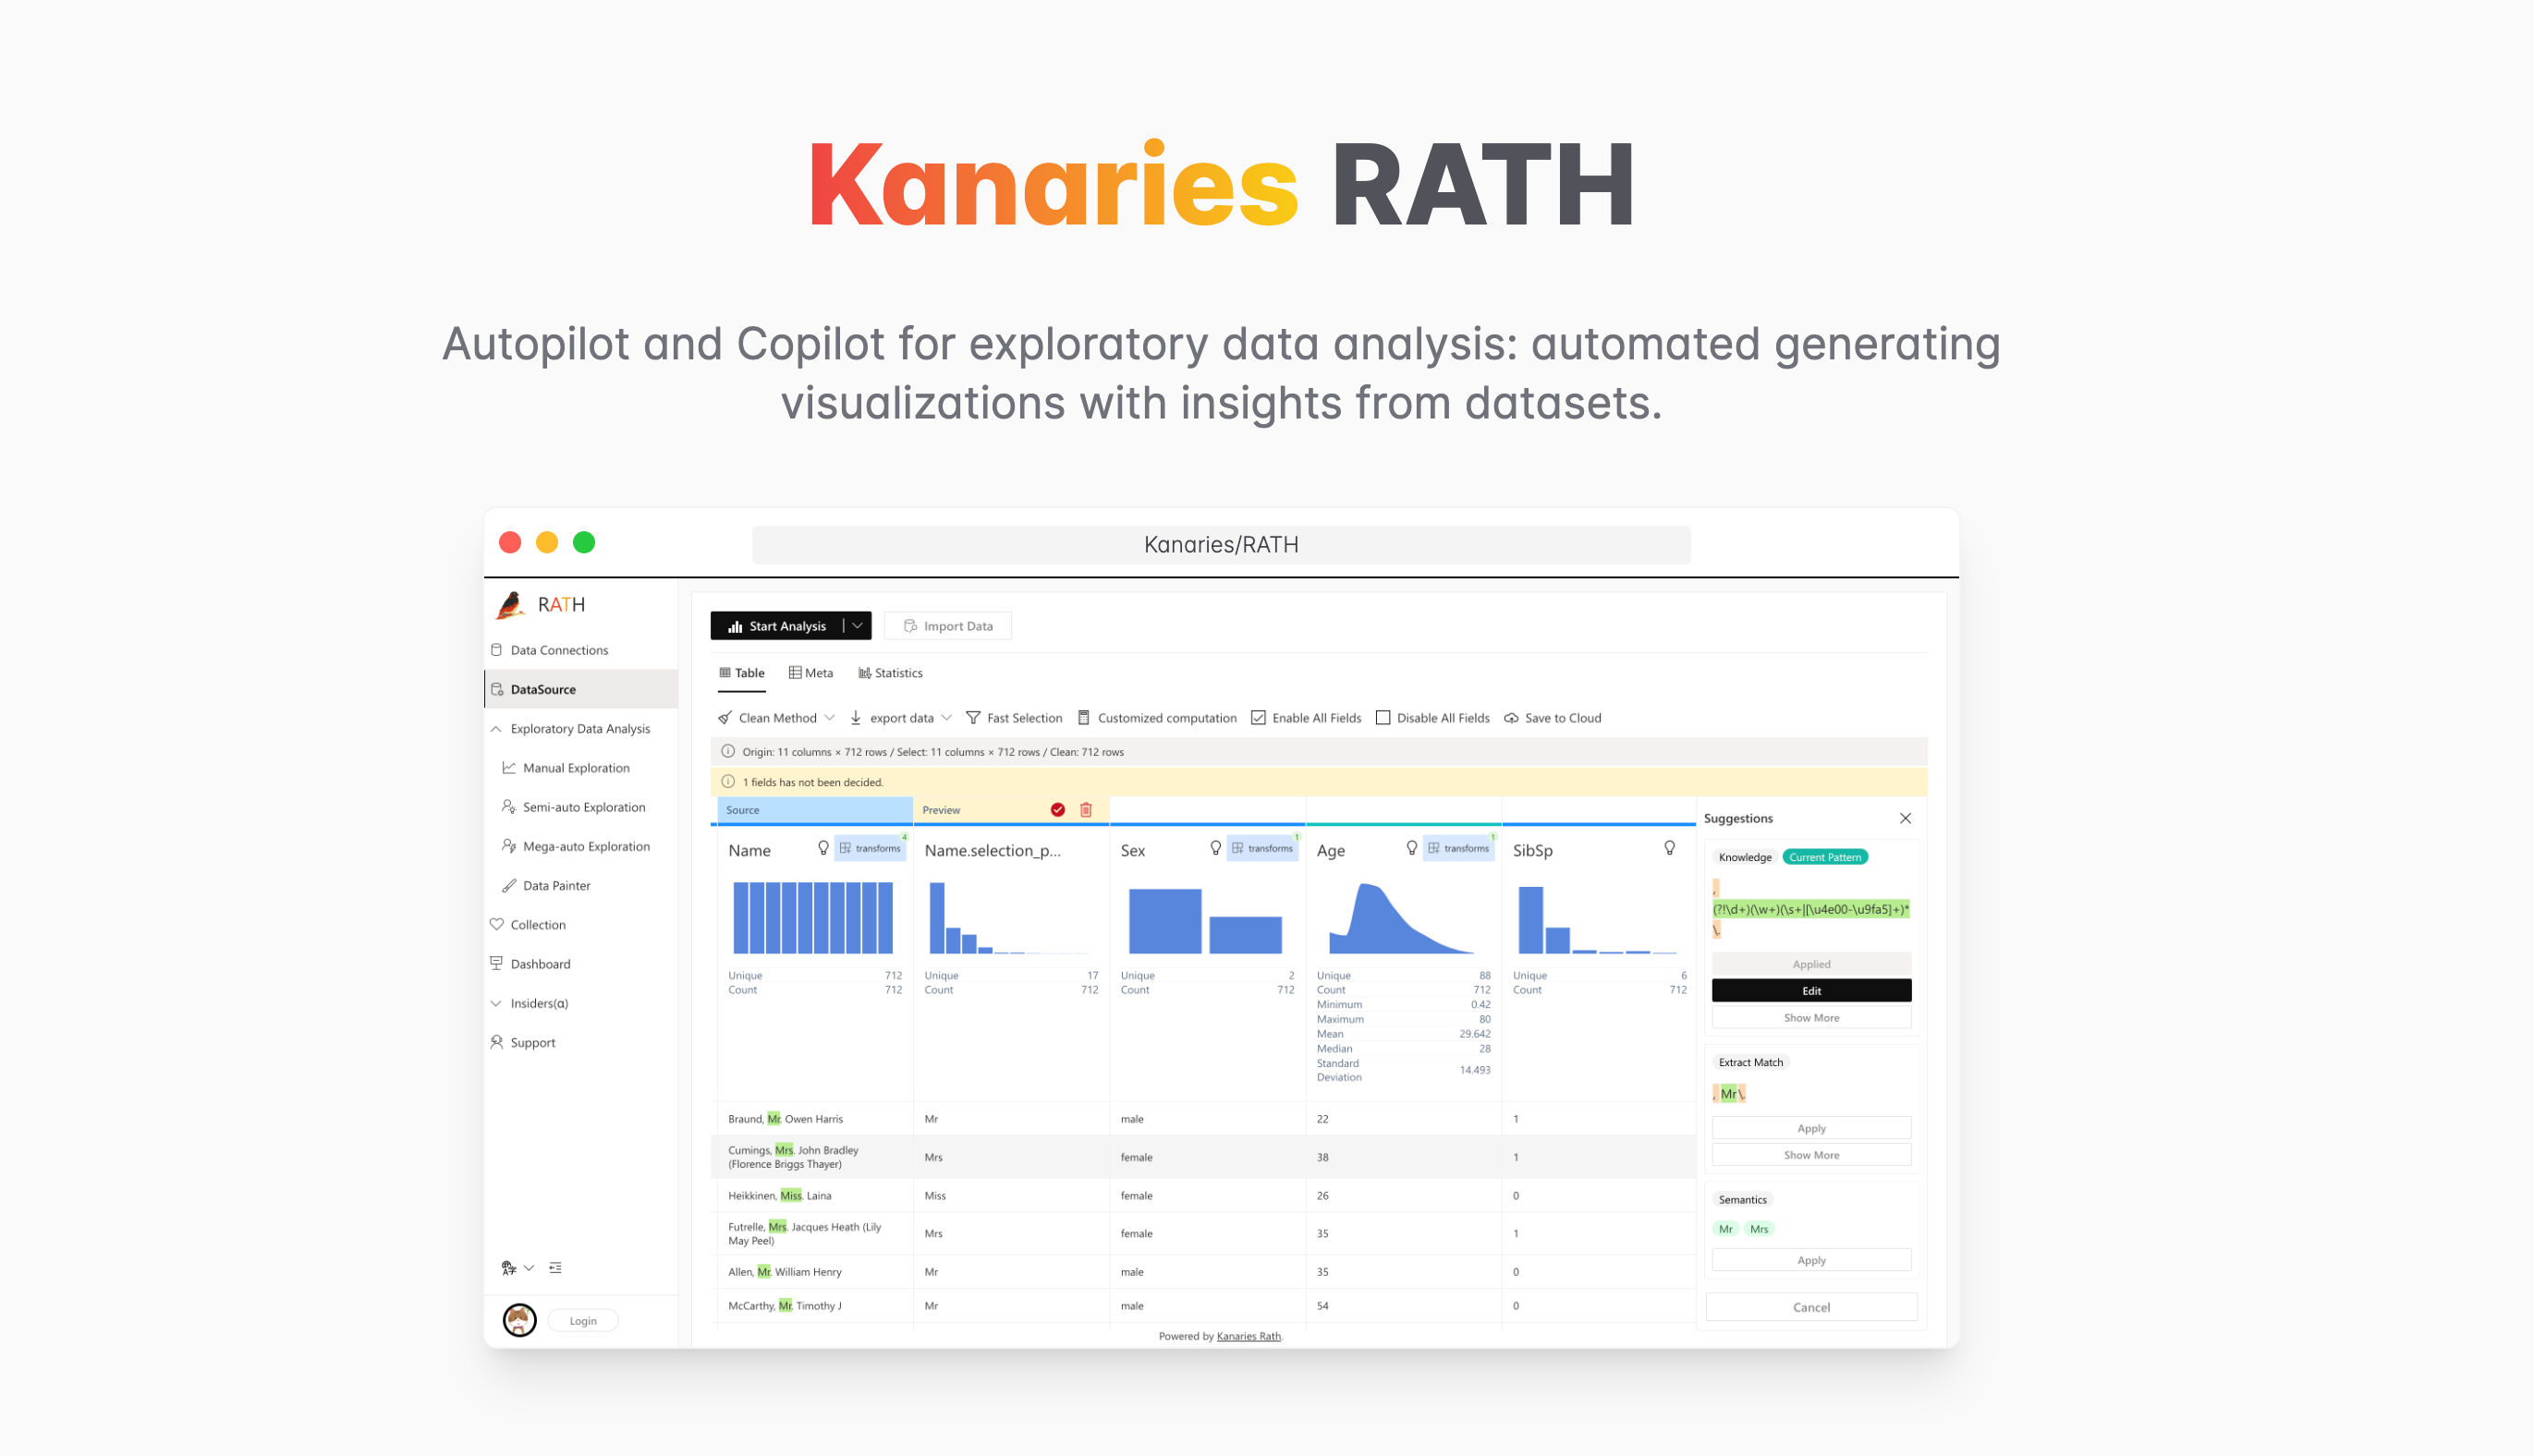

RATH is not just an open-source alternative to Data Analysis and Visualization tools such as Tableau, but it automates your Exploratory Data Analysis workflow with an Augmented Analytic engine by discovering patterns, insights, causals and presents those insights with powerful auto-generated multi-dimensional data visualization.
RATH generates/recommends visualizations based on minimize visual perception error of information in visualizations.
rath-walkthroughs-lite.mp4
Get started with RATH now!
- 🤖 AutoPilot for Data Exploration: Get Insights with One Click! Augmented analytic engine for discovering patterns, insights, and causals. A fully-automated way to explore and visualize dataset with one click.
-
🛠 Copilot for Data Exploration: RATH will work as your copilot in data science, learn your intends and generate relevant recommendations.
-
Natural Language interface: Ask questions in natural language to get answers/visualizations from your data.
- AutoVis: RATH will generate the best visualization for the data you selected. It makes you focus on data and variables, not how to make a visualization.
-
👓 Data Wrangler: Automated data wrangler for generating summary of the data and data transformation.
-
🎨 Data Painter: An interactive, instinctive yet powerful tool for exploratory data analysis by directly coloring your data, with further analytical features. Watch this video demonstrating about how to discover data insights with Data Painter.
-
📊 Dashboard: Build a beautiful interactive data dashboard (including a automated dashboard designer which can provide suggestions to your dashboard).
-
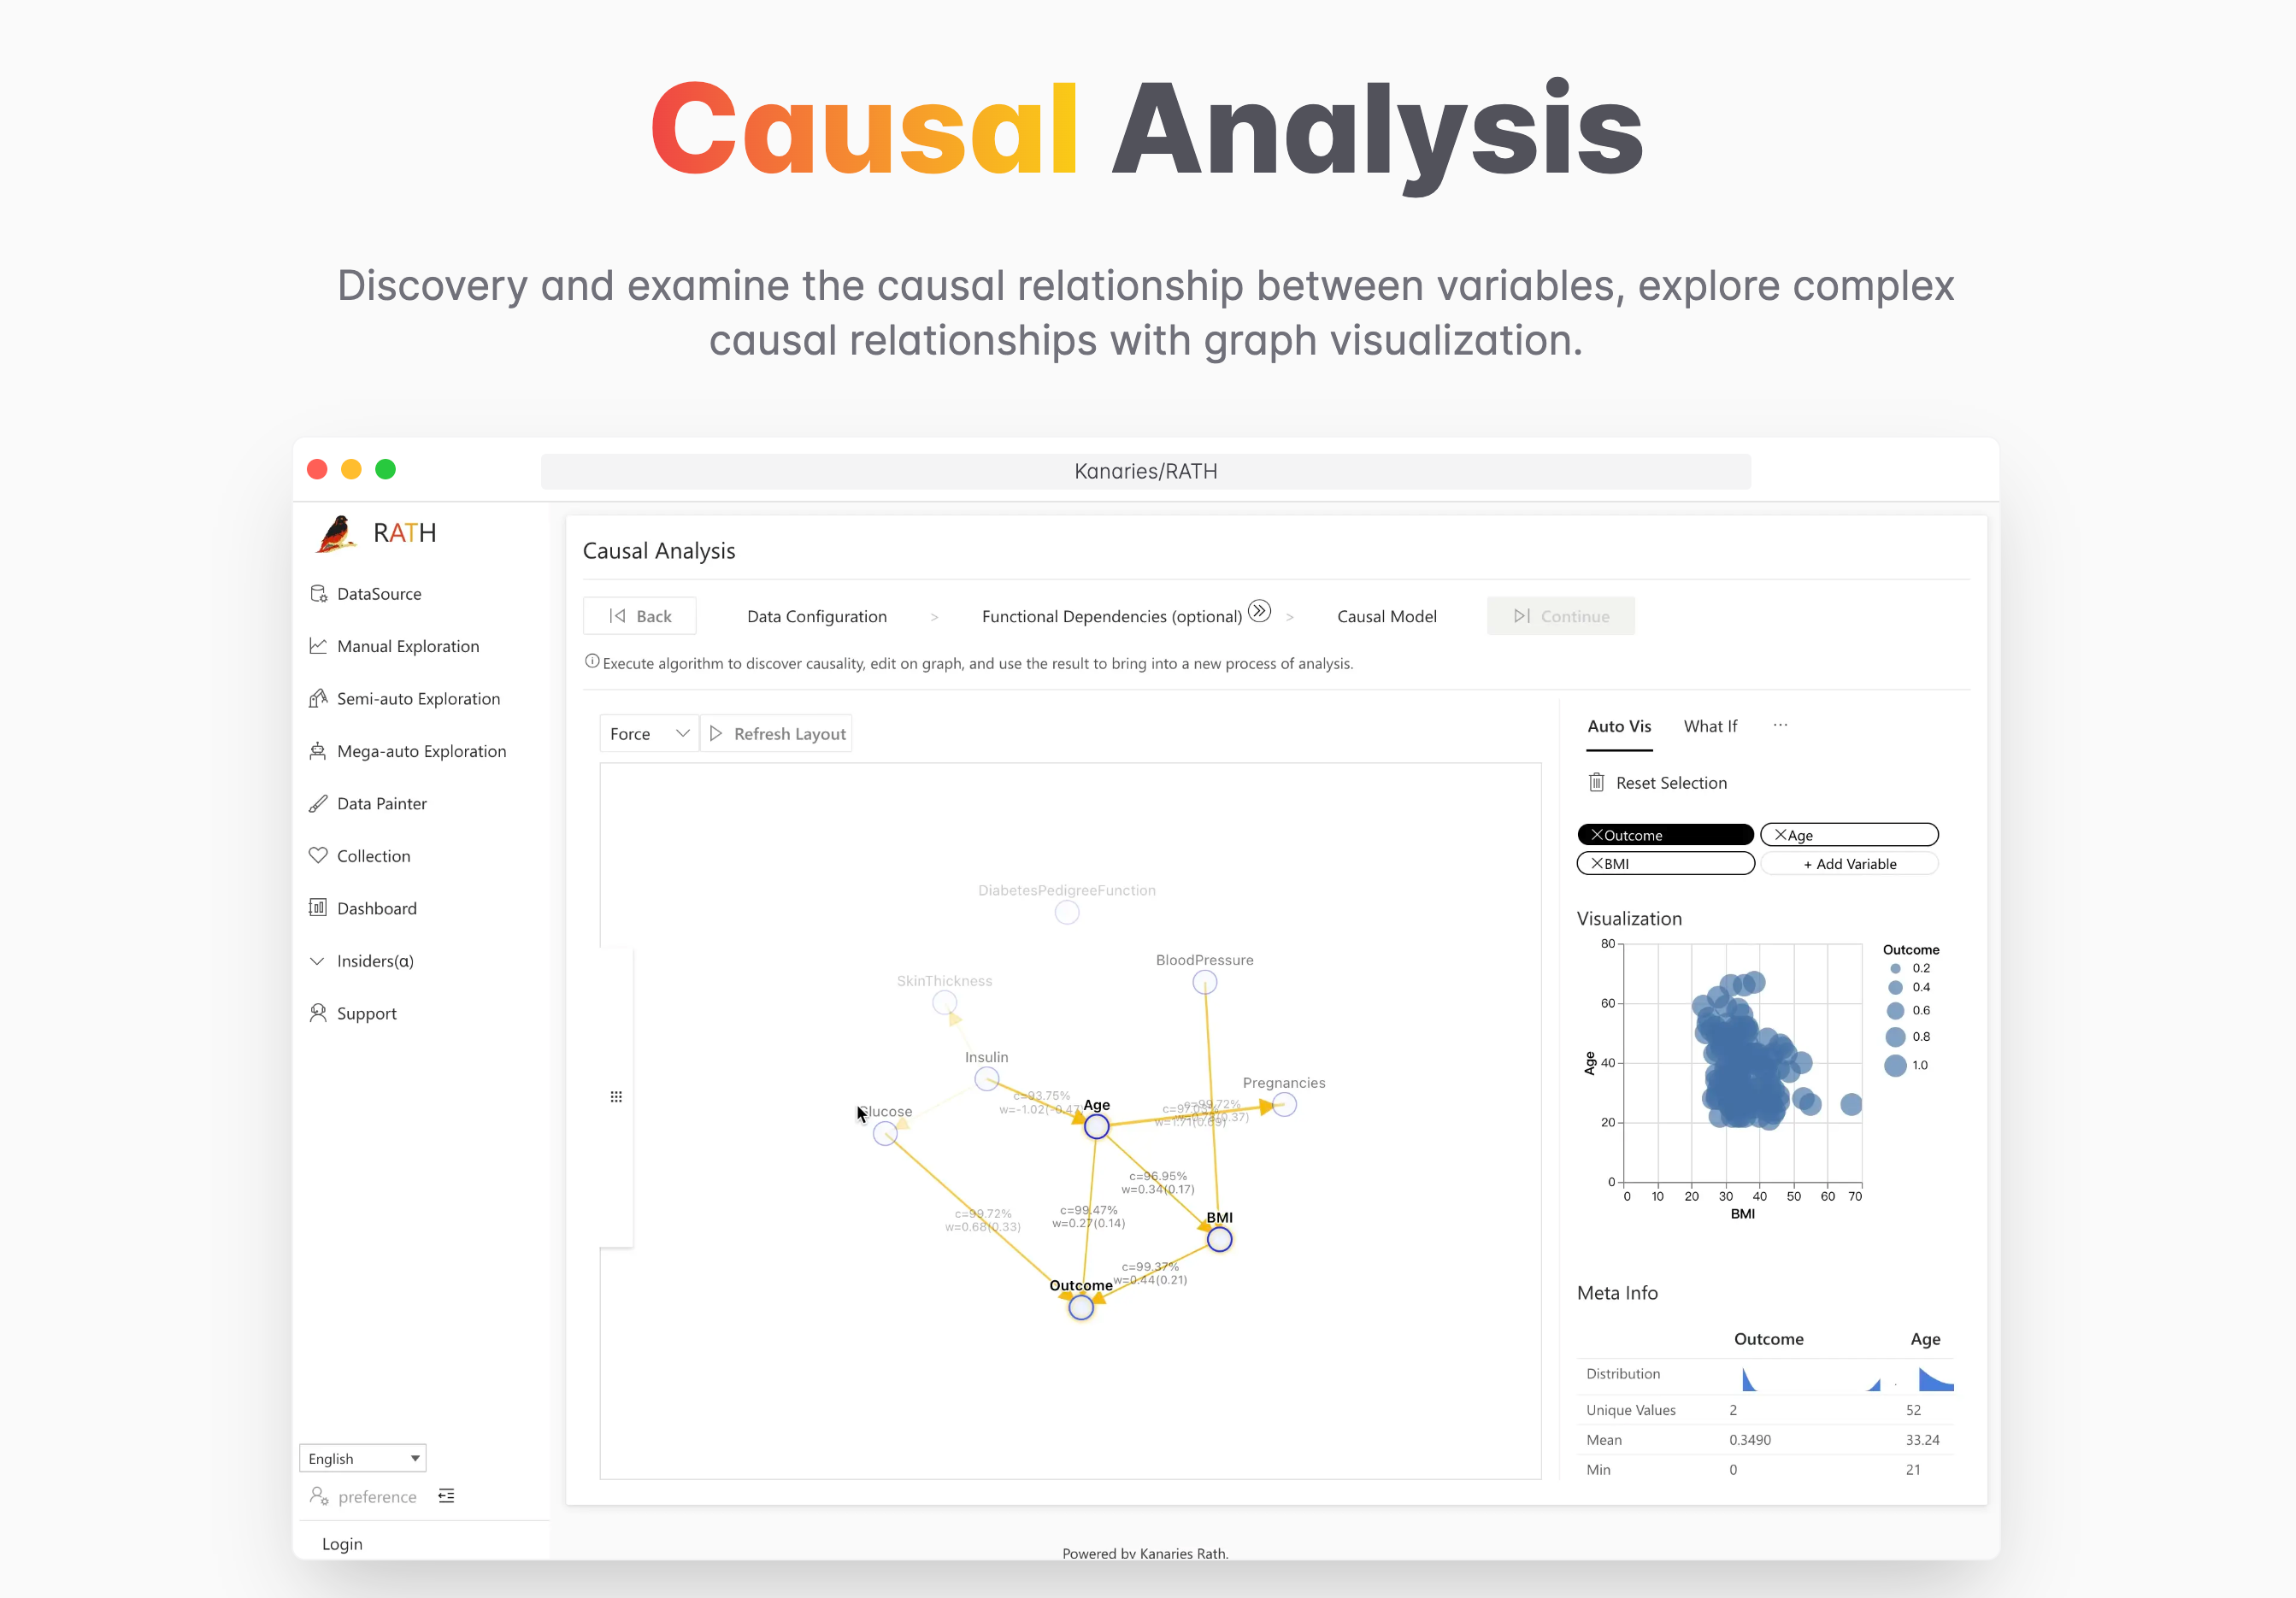
Causal Analysis: Identify and examine the causal relationship between variables, which can help explore the data, create better prediction models and make business decission.

RATH support data preparation with black magic like predictive transformation operations. It will automatically generate suggestions of transformations and cleaning, etc.
Augmented analytic engine for discovering patterns, insights, and causals. A fully-automated way to explore and visualize dataset with one click.

RATH will work as your copilot in data science, learn your intends and generate relevant recommendations.
semi-automation.mp4
Ask questions about your data, RATH integrates with GPT to generate answers and visualizations.
Manual Exploration is an independent embedding module. You can use it independently in your apps. For more details, refer to the README.md in in
packages/graphic-walker/README.md.Install Graphic Walker
yarn add @kanaries/graphic-walker
# or
npm i --save @kanaries/graphic-walker
Data Painter Video 🔥 on Youtube
Causal analysis could be defined as the way to identify and examine the causal relationship between variables, which can help explore the data, create better prediction models and make business decision.
RATH's causal analysis feature include:
- Causal Discovery
- Editable graphical causal models
- Causal interpretability
- Interactive tools for deeper exploration
- What-if analysis
For more about Causal Analysis features, refer to RATH Docs.
RATH supports a wide range of data sources. Here are some of the major database solutions that you can connect to RATH:


If you want to add support for more database types or data engines, feel free to Contact us
RATH software is in open alpha stage. We are working on improving its code and documentation.
build script for client parts
yarn install

yarn workspace rath-client build
If you are using RATH for your project(s), please let us know what are you using it for by emailing us at support@kanaries.org. Feedbacks are also welcomed. If you find a bug or have a feature request, please create an issue.
We encourage you to check out our RATH Docs for references and guidance.

Kanaries community is a place to have open discussions on features, voice your ideas, or get help with general questions. Get onboard with us through the following channels:
Our developer community is the backbone of the ongoing RATH project. We sincerely welcome you to join our community, participate in the conversation and stay connected with us for the latest updates.
Feel free to contribute to the RATH project, submit any issues on our GitHub page, or split your grand new ideas in our chats.


Please consider sharing your experience or thoughts about Kanaries RATH with the border Open Source community. It really does help!
Please check out the Contributing to RATH guide for guidelines about how to proceed.
Thanks to all contributors ❤️
Rath is an automated data analysis and visualization tool (auto-EDA). It is a free and open-source software licensed under the AGPL.
Branded icons are licensed under their copyright license.
Have fun with data! ❤️