Hello,
We have moved the project space for civisualize to CiviCRM's Gitlab. This includes both the issue tracking and support, and merge requests.
The new URL is: https://lab.civicrm.org/extensions/civisualize
All issues have been migrated to: https://lab.civicrm.org/extensions/civisualize/issues
If you do not already have an account on CiviCRM's Gitlab, you can create an account by registering on https://civicrm.org/user
Thank you!
Civisualize is a CiviCRM extension which let you visualize your CiviCRM data with the power of dc.js and d3.js. dc.js let users create graphs which enable filtering through the data with just a click on the graphs giving you a lot of powers. It's in beta, not going to hurt your data, do let us know if something works or doesn't.
Civisualize will help you out with ready to use visualizations that we have created and will provide you the right resources if you plan to create your own custom visualization.
Since 2023 this extension is now hosted on CiviCRM's Gitlab:
https://lab.civicrm.org/extensions/civisualize
Civisualize can be installed directly from within the CiviCRM user interface. See the user manual for details: Installing extensions.
If you are a developer you can clone Civisualize into your CiviCRM extension directory using:
git clone https://lab.civicrm.org/extensions/civisualize.git
The list of core visualizations is available at Reports > Civisualize. The currently available visualizations include:
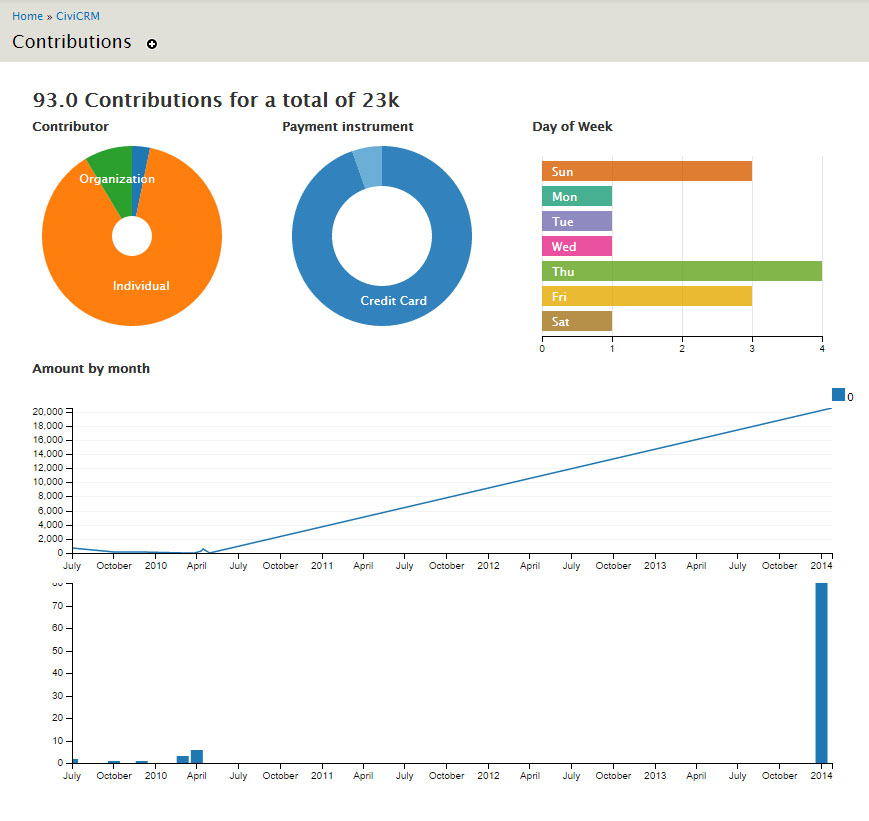 This provides an overview of contributions, type of contributors, the day of week the contribution was made, payment instrument, etc.
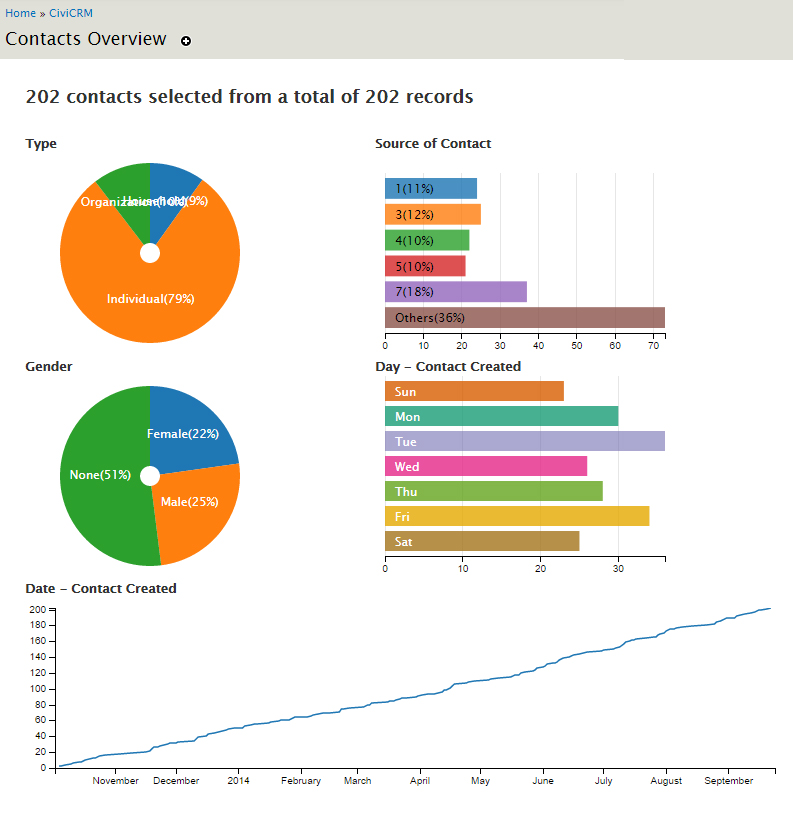 Contacts overview is a compilation of graphs showing types, gender, age, source of contact, contacts over the time etc.
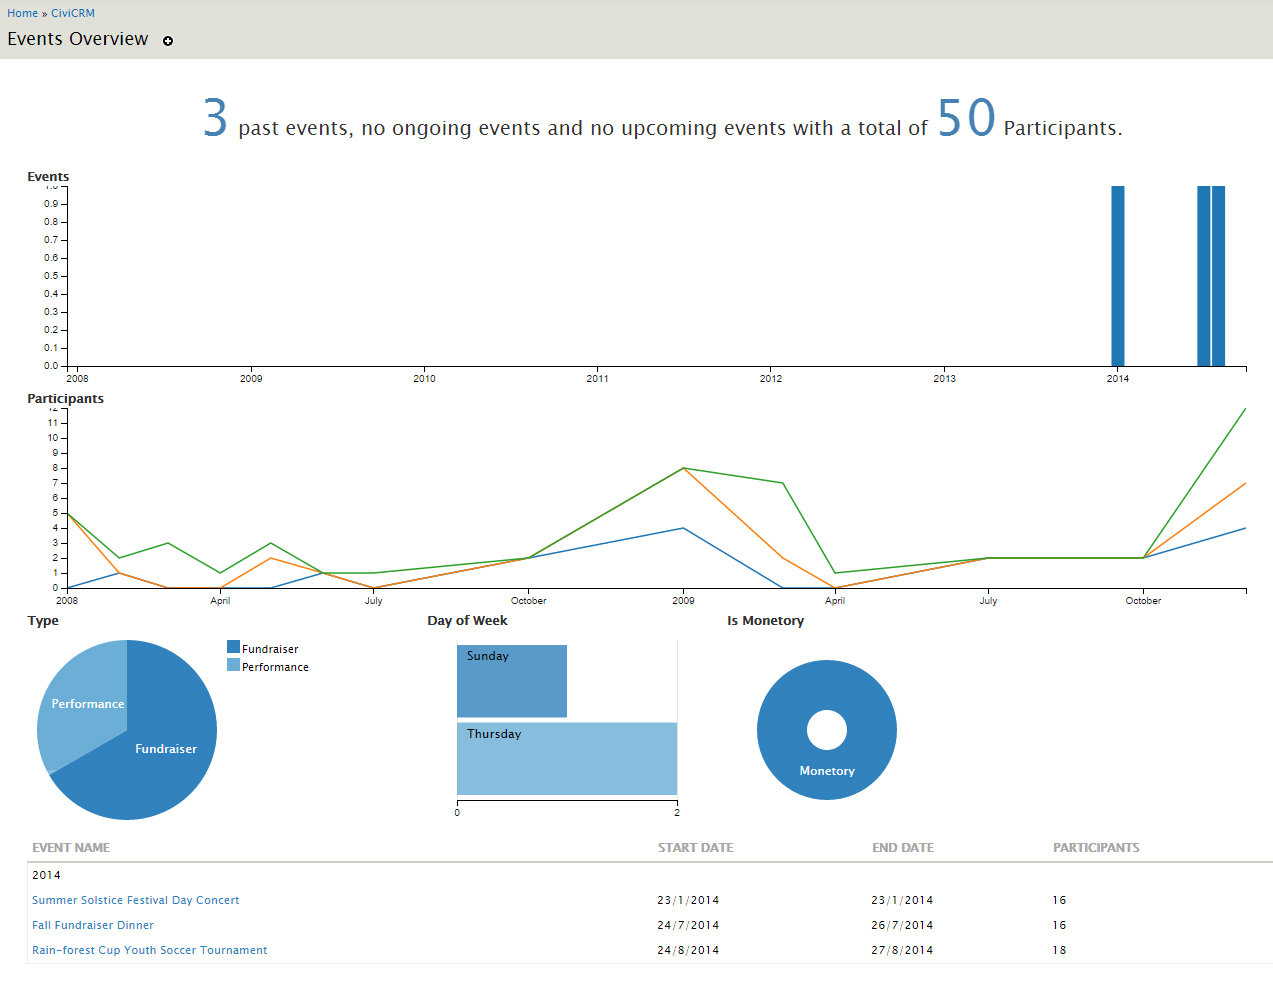 Events shows a lot of information about all the events of an organization and their participants. It shows events over time, participants over time, money generated from events, type of events, etc. It also displays a table listing all the events.
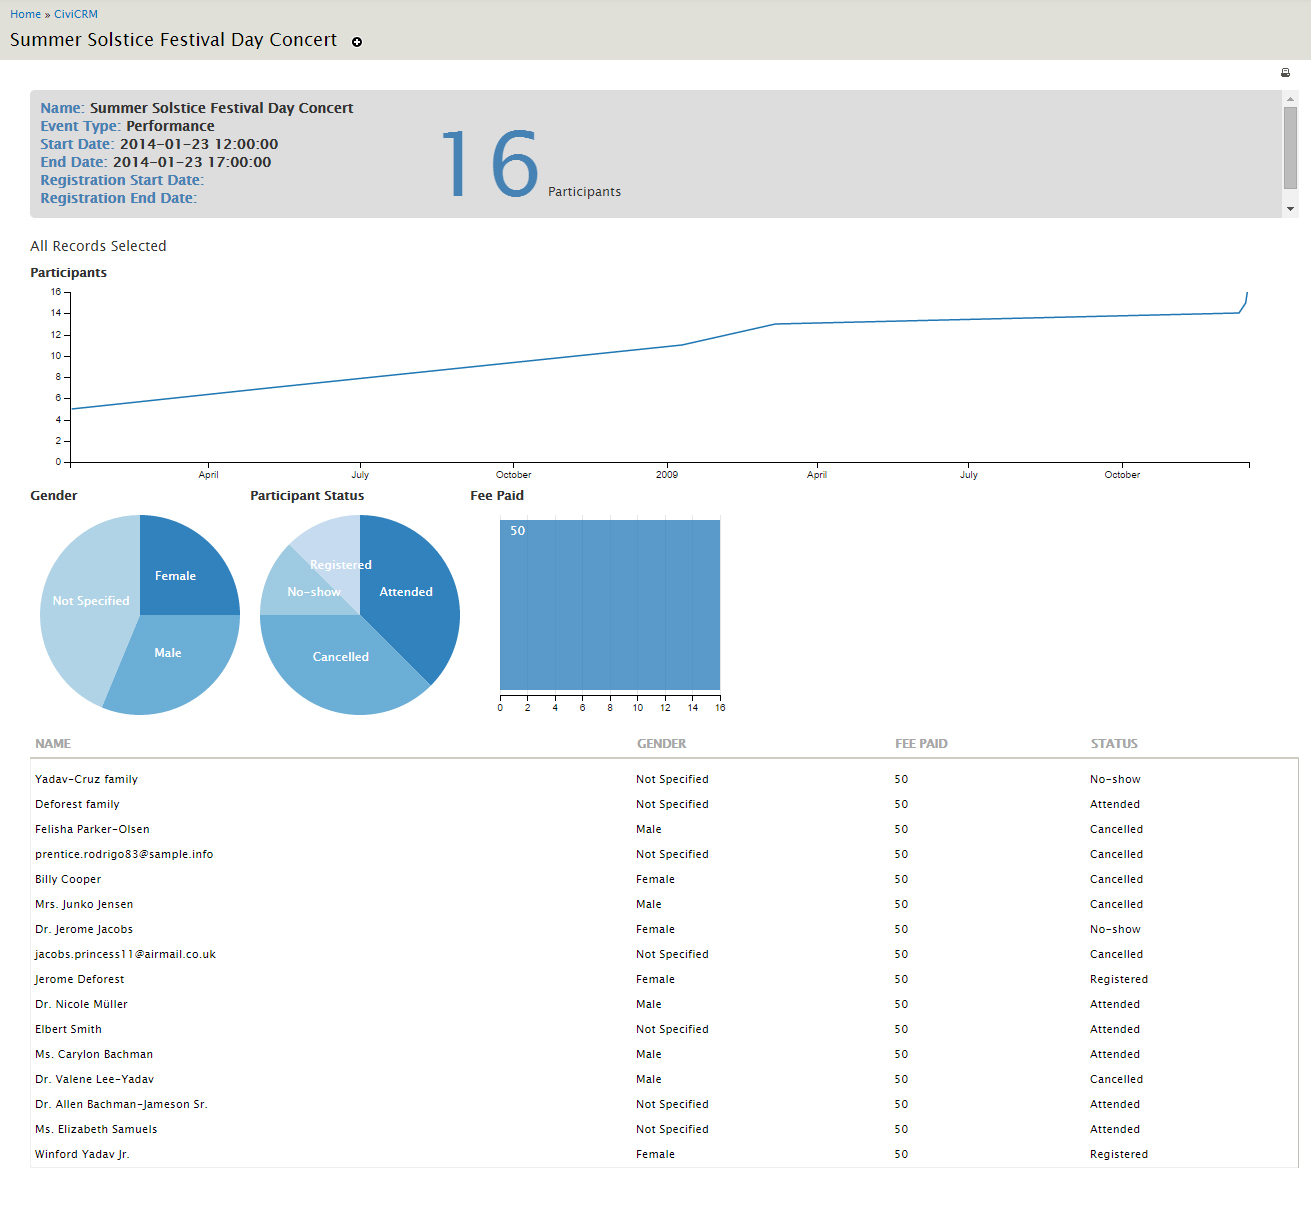
This table further links to specific event overview (/dataviz/event/) showing participants, their status, their fee etc.
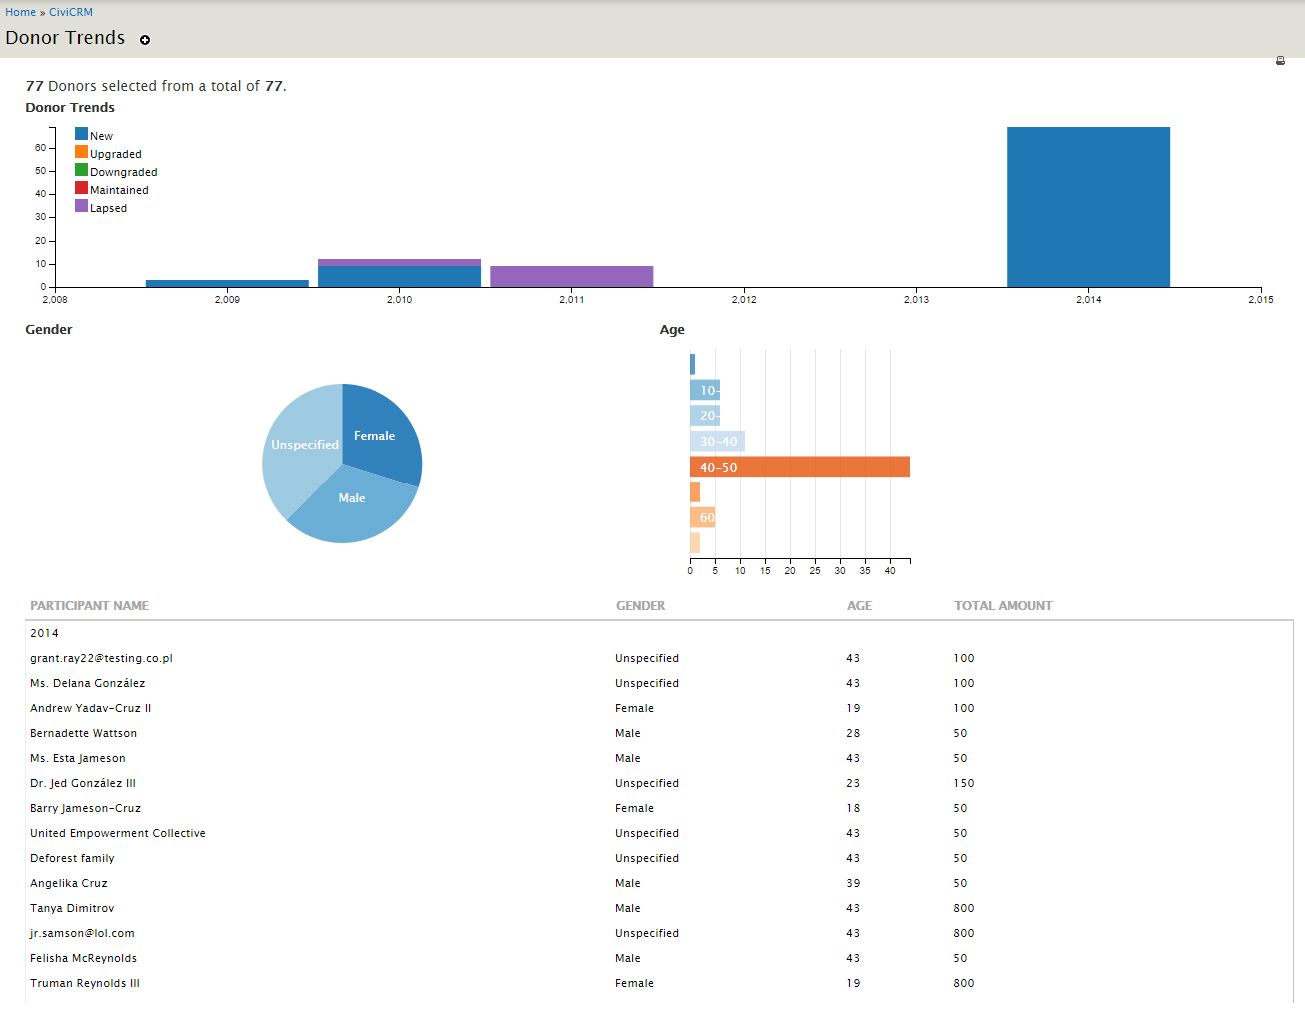 Based on the idea of CiviCRM Donor Trends Extension, the donor trends overview showcases a Bar Chart with new, lapsed, upgraded, downgraded and maintained donors over the years. This further showcases the gender and age of the donors and a list of all the donors.
Need not be mentioned, you can add more graphs and details to the above mentioned visualizations.
If you are a developer you can customize or create your extensions with a little knowledge of mysql/crmAPI, d3.js/dc.js and crossfilter. Civisualize basically has two parts:
- Extract data from CiviCRM
- Display data using dc.js/d3
For the first part, we are using the following methods:
{crmAPI entity="OptionValue" option_group_id="14"}
You can add getstat as a new action on some entities in the api.
We have added a new crmSQL to run a mySQL query. For obvious reasons crmSQL only let you run SELECT queries. You can get your data using any of the following three methods:
-
{crmSQL sql="SELECT count(*) ... group by ...."} -
{crmSQL query="somethingcool"}This will fetch the sql query from
/queries/somethingcool.sql -
{crmSQL json="somethingcooler" cid=4 bla="hello"}This will fetch a json object from
/queries/somethingcooler.jsonThe format of the json is{ "query":"SELECT * from ABC where id=%1 and bla=%2", "params":{ "1":{ "name":"cid", "type":"Integer"}, "2":{ "name":"bla", "type":"String"} } }You can further use
{crmRetrieve var="a" name="b" type="Integer"}. This will assign thePOSTorGETvariable namedbintoawhich can then be given to{crmSQL}.{crmSQL set="varname"}will assign the result of the sql query to a smarty variable namedvarname.{crmSQL}returns a json of the following format:{"is_error":0,"error":"error_str","values":"Array of objects"}so we primarily use
{crmSQL}values for our visualizations. -
A 3rd option is to be able to fetch data from a report instance using
{crmReport...}. Eileen has done (most of?) the work already. I think it's on 4.5.
The principle is to get the data in a template as a json, and apply dc on it until it looks awesome. You simply have to create a template into templates/dataviz/Something.tpl. Once you have the data from the above methods you can apply dc on it, and you can access it from /civicrm/dataviz/something.
To get you started, you can visit /civicrm/dataviz/contribute or any of the above mentioned visualizations.
This is using the wonderfully magic dc, that is a layer of love on the top of d3 and crossfilter. Click on the graphs to filter down. magic, I told you. No matter if you use {crmAPI} or {crmSQL}, you end up with a json and a d3 and dc loaded and ready to rock.
In the template, put:
<div id="theplacetograph"></div>
<script>
  // Load the data into 'mydata' from Smarty.
  var mydata={crmAPI or crmSQL};
  // Turn off Smarty's interpreter from here, it gets confused by Javascript and CSS.
  {literal}
  // We do everything in an anonymous function so we are free to use any
  // variable names we need without clobbering those in the global scope.
  (function() {
    // Define the function that will make your charts etc.
    function bootViz() {
      // Ensure we're using the up-to-date libraries, not the CiviCRM core ones.
      var d3 = CRM.civisualize.d3, dc = CRM.civisualize.dc, crossfilter = CRM.civisualize.crossfilter;

      //
      // This is where you do your stuff.
      //
      d3("#theplacetograph").selectAll(...).data(mydata.values).domagic(...);
    }

    // Boot our script as soon as ready.
    CRM.civisualizeQueue = CRM.civisualizeQueue || [];
    CRM.civisualizeQueue.push(bootViz);

  })(); // Immediately call our anonymous function.
We have also used {crmTitle} function which let you set the title of the page, and a print_filter function that will help you in playing around with crossfilter.
Check our resources at dc.js and create your first visualization.
You can include reset links in your charts to reset all the filters for a particular chart.
-
after defining your chart, save a reference to it using a unique name like so:
CRM.civisualize.charts.yourChartsUniqueName = yourPieChart; -
At the end of these, call
CRM.civisualize.bindResetLinks();to make sure all the reset links are ready. -
Include links in your chart's container div like so:
<a class="reset civisualize-reset" href data-chart-name="yourChartsUniqueName" >Reset</a>
The links should normally be hidden until you click to add a filter. See Contacts.tpl for an example use.
If you want to add a document, add a markdown file that has the same name as the template into the doc folder.
xavier made this, sid helped him. You can find us on CiviCRM forum, @eucampaign and @sid0_o on Twitter, or in the dc mailing group. Be warned, d3 is awesome, but the learning curve is steep. Worthwhile, the view at the top is beautiful.
- Update civix boilerplate to work with PHP 7.4 without warnings.
It became apparent that version 5's library updates conflicted with CiviCRM's
core libraries. To avoid this v6 now puts its own versions of dc, d3 and
crossfilter under CRM.civisualize as a namespace.
There were also loading problems: we need the DOM loaded (not as simple as it
sounds, given the three types: normal page loads, cached dashboard,
refreshed/new dashboard) and we need CRM.civisualize to have been created
already, which it might not. To fix this we've implemented a queue similar to
Google analytics etc.
And some issues with scripts using the global namespace for their vars.
And we tidied up the reset links.
So whereas before you might have just put your code in a <script> block and
started calling d3.... now you should wrap your code and boot it as shown
above.
Note you might find this breaks your dashboards. If this happens you'll need to clear your browser's "local storage".
The libraries have been upgraded as follows:
- d3 from 3.5.17 to 5.7.0
- dc from 3.0.10 to 2.0.2
- crossfilter to 1.3.12
The d3 upgrade requires changes to templates. These are detailed at https://github.com/d3/d3/blob/master/CHANGES.md.
There's a PHP command line helper tool updateTpl which may help... or not. It
doesn't cover everything (feel free to improve it!), but it was able to convert
all the bundled visualisations. Top tip: if/when you run it and you get a
warning about d3.time.format().parse, it's best to revert to the backup (the
script makes a backup for you), edit your original to a format that the
converter can then handle. Once you've understood it, it's not difficult. Then
run the converter and test.