Home
You can now find it at http://qupath.readthedocs.io
This page is very out of date - it refers to QuPath v0.1.2 and earlier.
For recent versions of QuPath, please use ReadTheDocs, YouTube or ask for help on the forum at https://forum.image.sc/tag/qupath
This is was the main place for QuPath documentation, to help you become familiar with using QuPath for whole slide image analysis.
You can download QuPath from the Latest Release page.
Below are some of the main features of the QuPath software. If you want to learn more, please use the links on the right sidebar to get started.
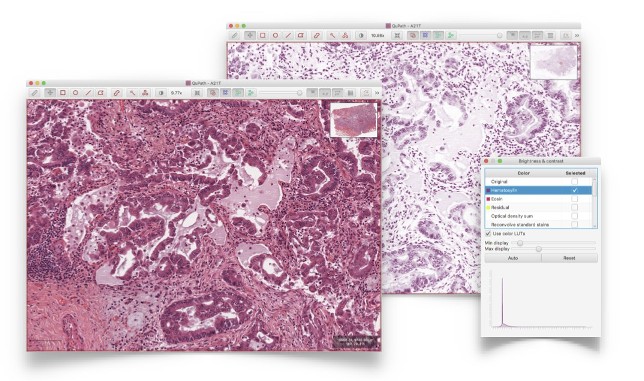
Fast, flexible image viewer capable of displaying whole slide images (often > 30 GB uncompressed) using dynamic color transforms (e.g. stain separation) and tracking slide navigation
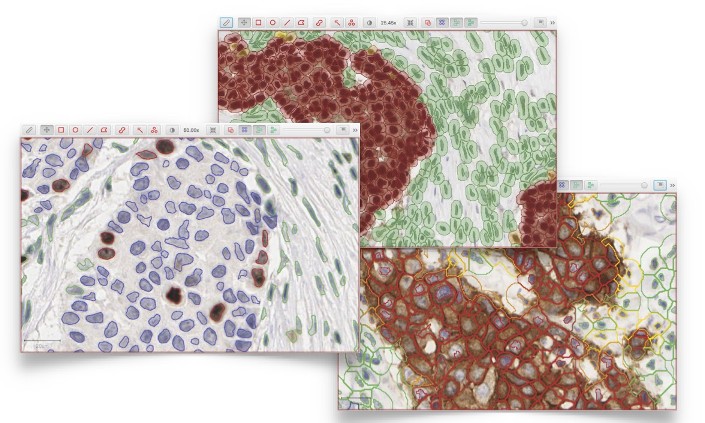
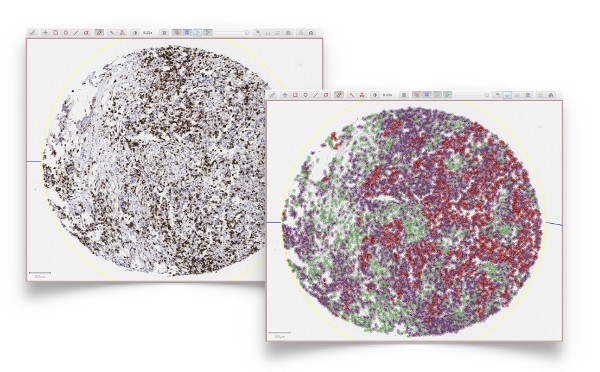
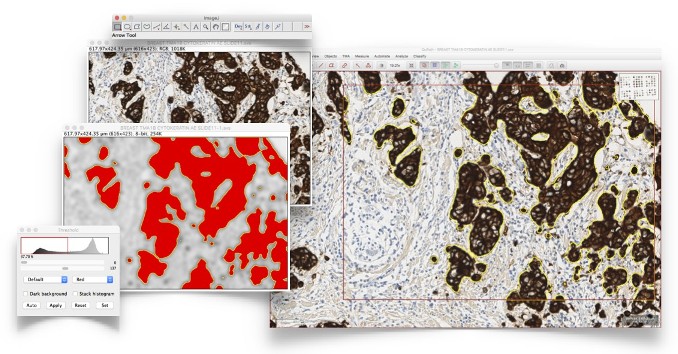
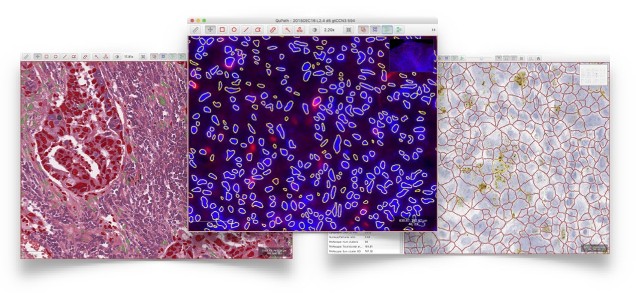
Nuclear, cytoplasmic & membranous biomarkers can all be quantified quickly using automated segmentation algorithms combined with trainable cell classification
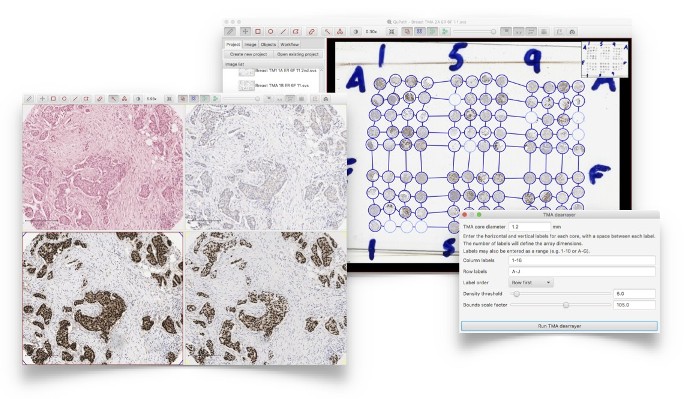
Automated dearraying of Tissue Microarrays and the ability to view related cores side-by-side
Powerful tumor identification algorithms can be applied directly to slides of interest - including slides stained for immune cells - without the need to stain for a separate tumor marker
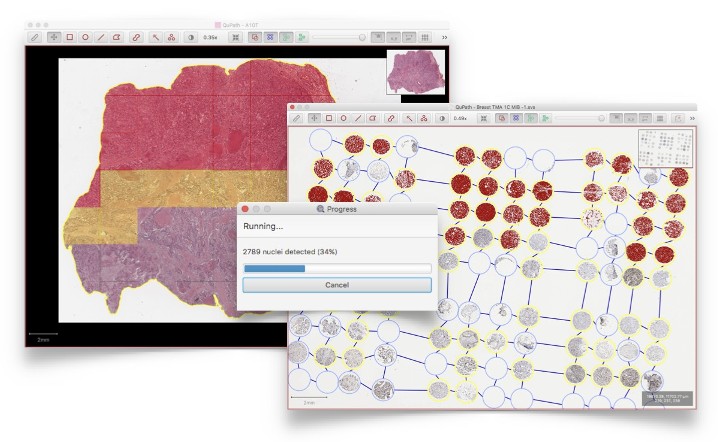
Large image regions are split into tiles where necessary, and these tiles analyzed in parallel with efficient algorithms - giving fast results without requiring specialist hardware
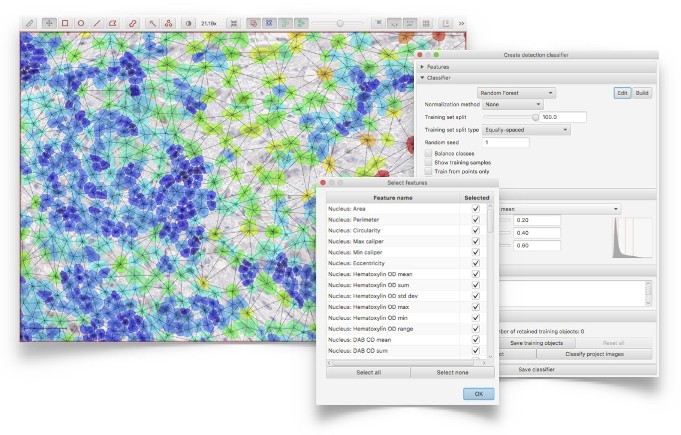
Apply object classification with the default ‘out-of-the-box’ random forest classifier (from OpenCV), or create highly-customized algorithms by tuning the choice of classifier, parameters and features used
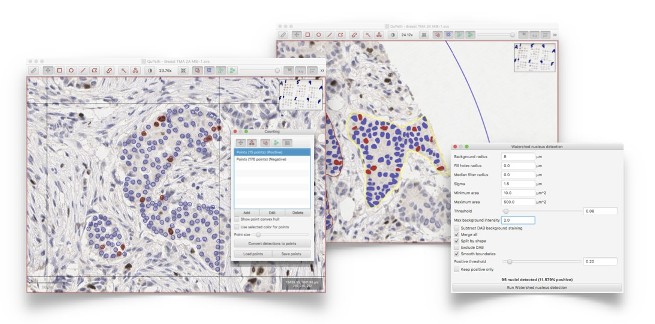
Extensive tools for slide navigation, annotating areas, exporting image regions or counting cells - either manually, or using automated cell detection
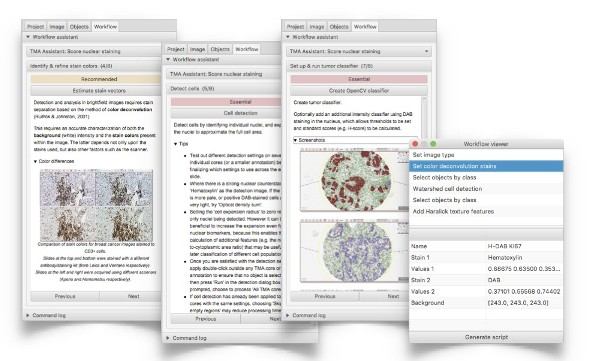
Workflows provide guided analysis for common tasks, or users can devise their own approaches by running commands in any order, which are automatically logged for reproducibility
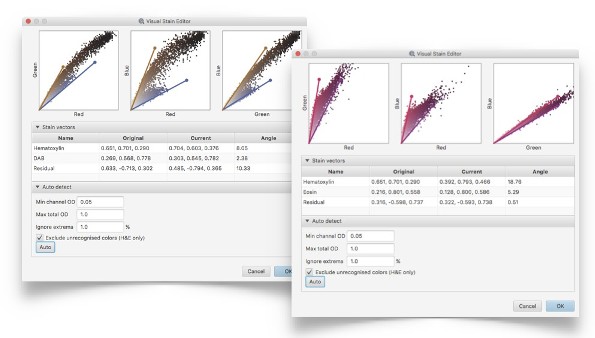
Analysis can be tailored to different stains and scanners using advanced stain estimation, visualization & optimization tools
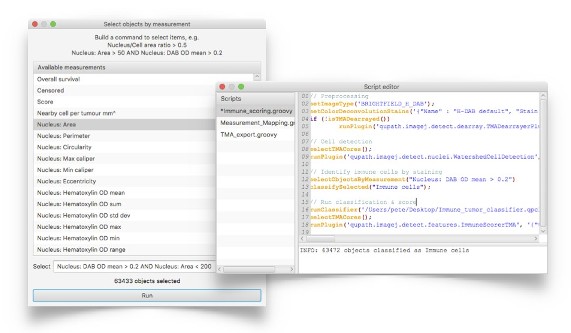
Experienced users can enter commands and write scripts to perform sophisticated, customized analysis using QuPath’s powerful, efficient hierarchical data structures
Exchange data with open source tools (e.g. ImageJ), or read images from a variety of sources, including cloud-based hosting
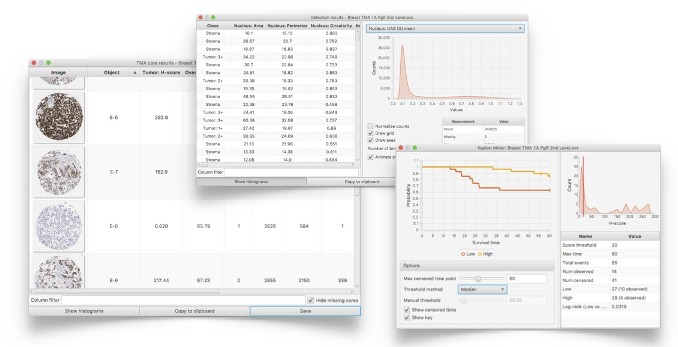
Create interactive results tables, histograms, scatterplots & survival curves directly within QuPath, or export results in standard formats to import into other software if required
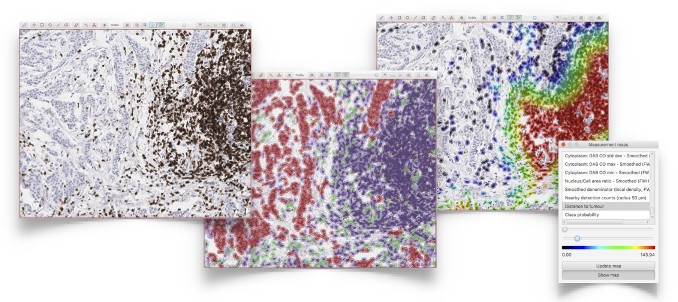
View measurements in context by color coding objects according to their features, e.g. to identify hotspots or visualize cell distributions for immuno-oncology applications
QuPath has been developed as a cross-platform application that runs on Windows, Mac OS X and Linux to support a wide range of applications and image types across pathology and the biosciences
The QuPath software has been developed as part of projects that have received funding from:
- Invest Northern Ireland (RDO0712612)
- Cancer Research UK Accelerator (C11512/A20256)