This functionality has been integrated into CIDER itself. Don't use this project if using a version of CIDER with built-in profiling, as it would cause problems.
nREPL and CIDER support for thunknyc/profile.
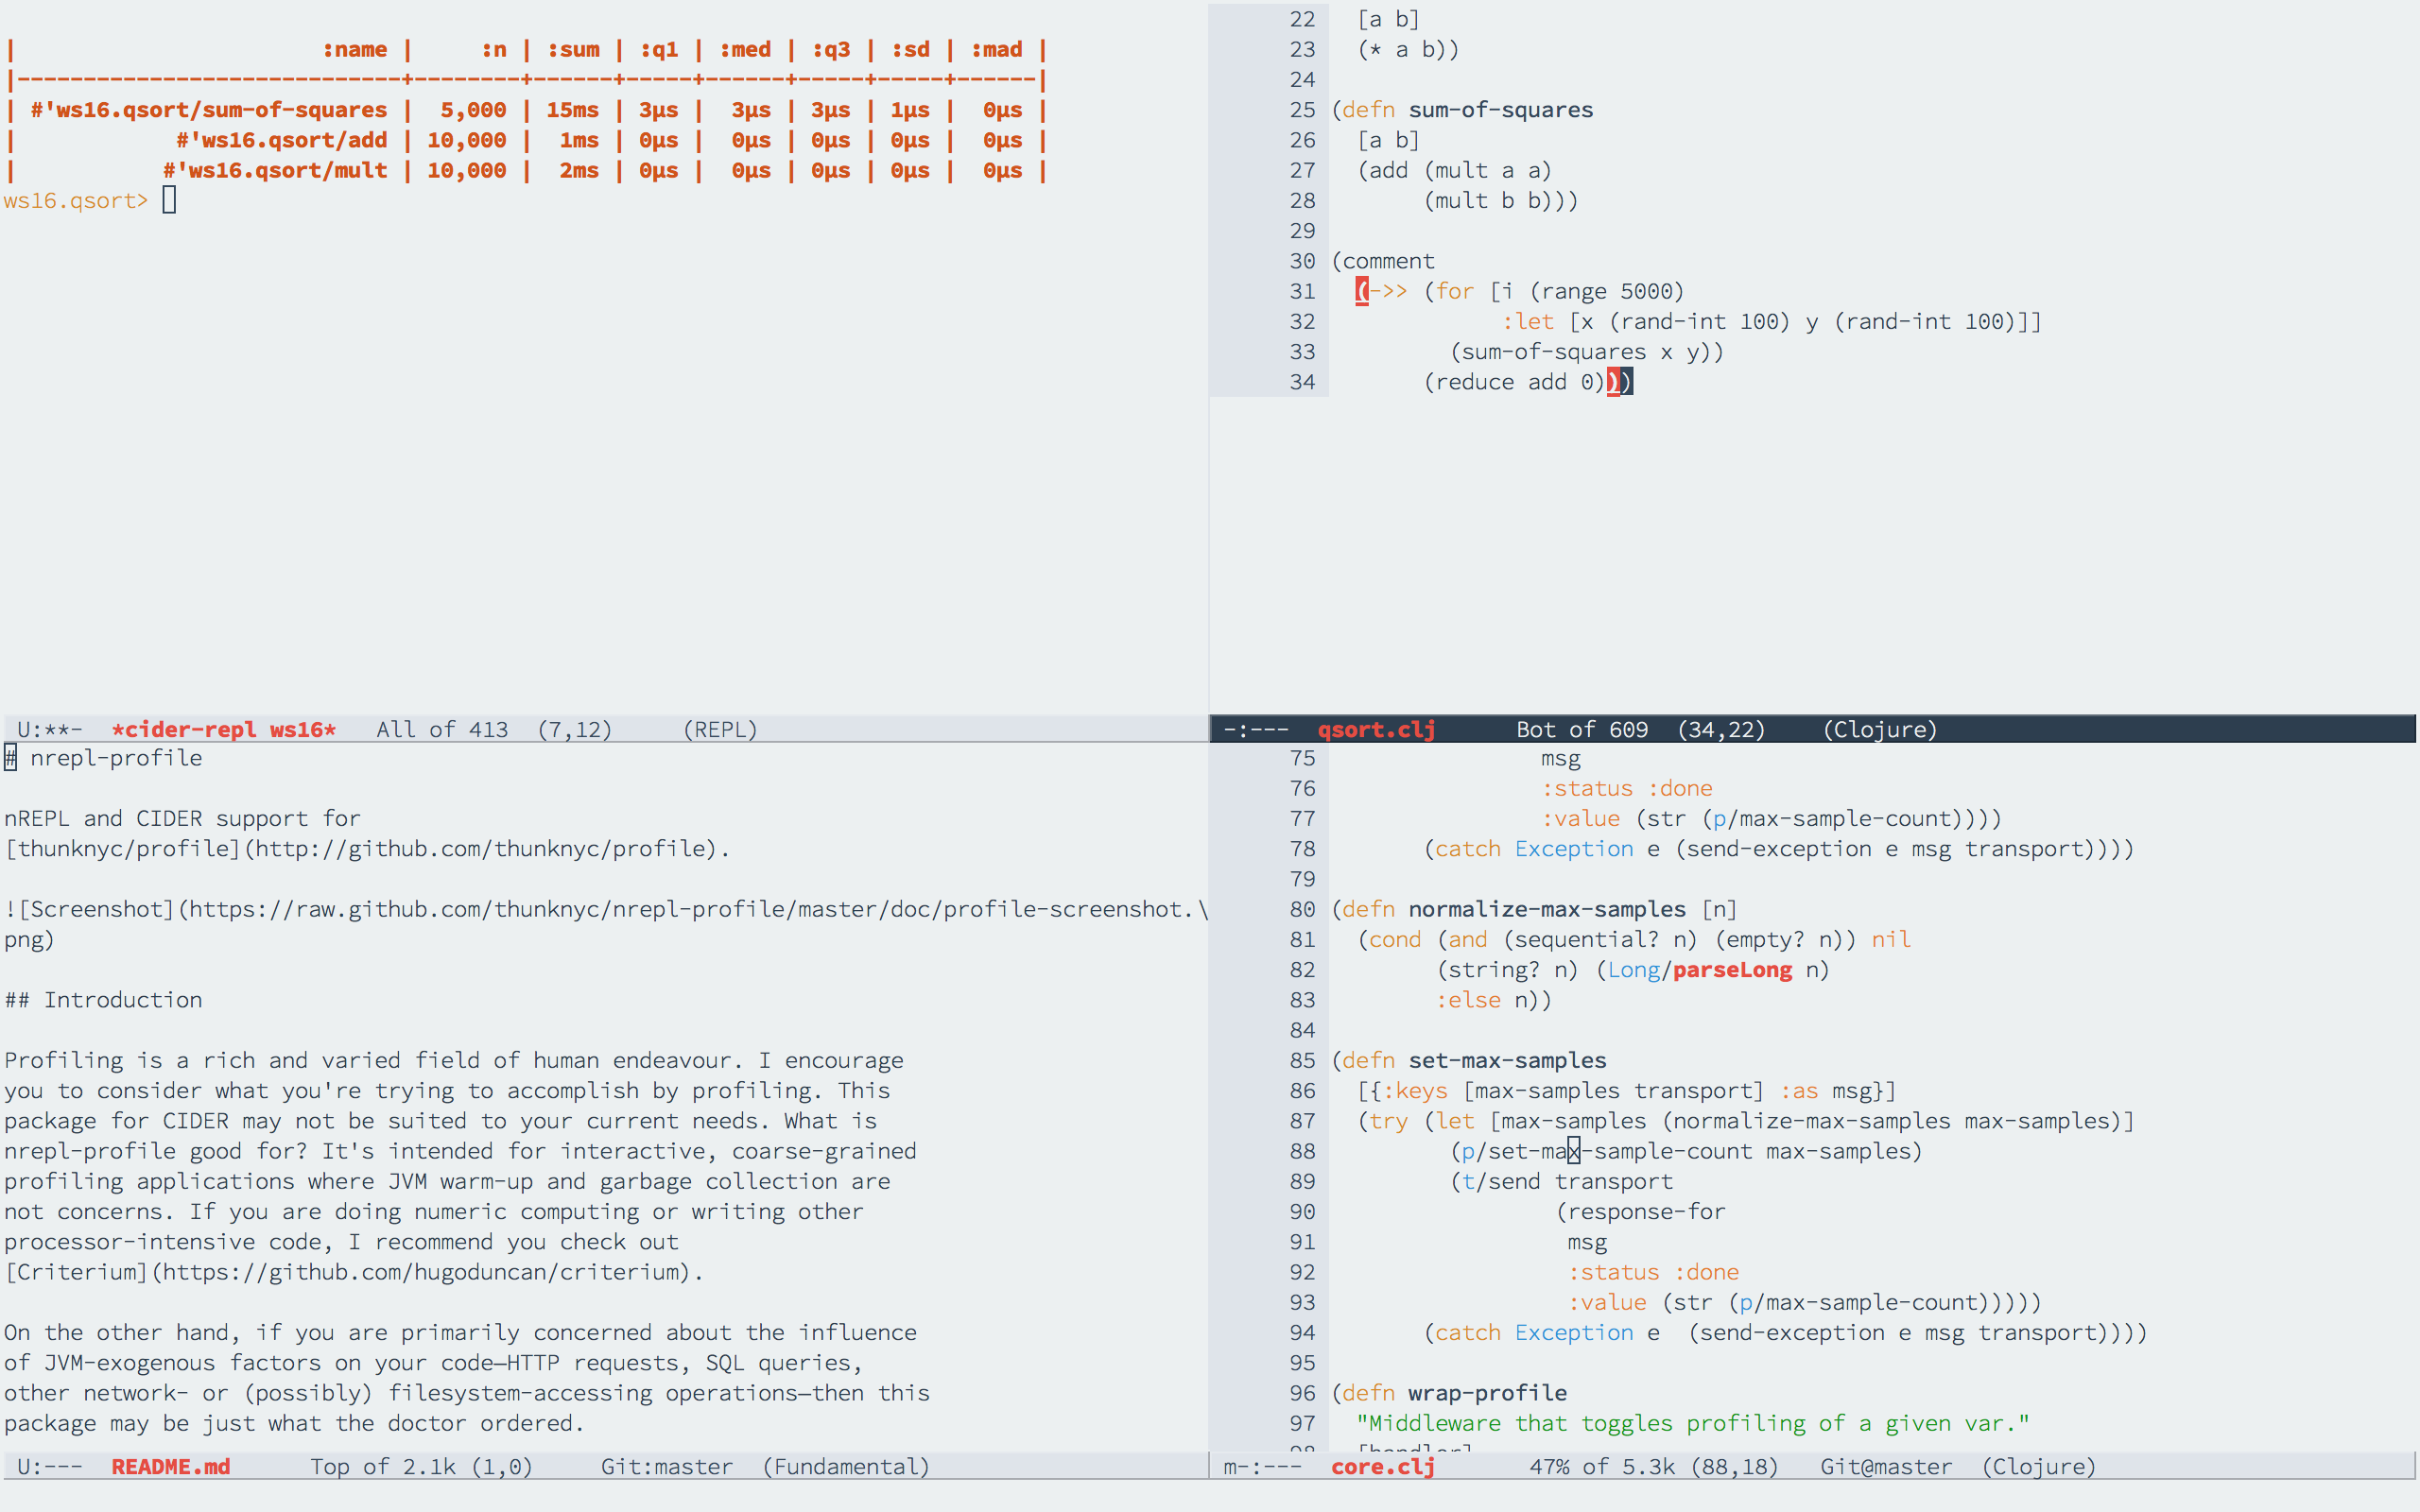
Profiling is a rich and varied field of human endeavour. I encourage you to consider what you're trying to accomplish by profiling. This package for CIDER may not be suited to your current needs. What is nrepl-profile good for? It's intended for interactive profiling applications where you do not expect a profiling tool to automatically compensate for JVM warm-up and garbage collection issues. If you are doing numeric computing or writing other purely functional code that can be executed repeatedly without unpleasant side effects, I recommend you at the very least check out Criterium.
If you are primarily concerned about the influence of JVM-exogenous factors on your code—HTTP requests, SQL queries, other network- or (possibly) filesystem-accessing operations—then this package may be just what the doctor ordered.
Add [thunknyc/nrepl-profile "0.1.0-SNAPSHOT"] to the vector
associated with the :plugins key of your :user profile inside
${HOME}/.lein/profiles.clj. Schematically, like this:
{:user {:plugins [[thunknyc/nrepl-profile "0.1.0-SNAPSHOT"]]}}Obviously the plug-in for CIDER needs to be in there too.
For Emacs, stick cider-profile.el somewhere accessible and add
(require 'cider-profile) to your ${HOME}/.emacs,
${HOME}/.emacs.d/init.el, whatever.
Add the following to your init.el, .emacs, whatever:
(add-hook 'cider-mode-hook 'cider-profile-mode)
(add-hook 'cider-repl-mode-hook 'cider-profile-mode)
If you would like to display profiling statistics in the current repl window instead of in a pop-up window, do the following:
(setq cider-profile-buffer nil)
Cider-profile includes the following keybindings out of the box:
C-c =Toggle profiling of var under point.C-c +Toggle profiling of namespace.C-c M-=Report whether var under point is profiled.C-c M-+Display (and, withC-u, set) current maximum per-var samples.C-c -Display summary of profiling data.C-c M--Display profiling data for var under point.C-c _Clear collected profiling data.
Copyright © 2014 Edwin Watkeys
Distributed under the Eclipse Public License either version 1.0 or (at your option) any later version.