PDV: an integrative proteomics data viewer


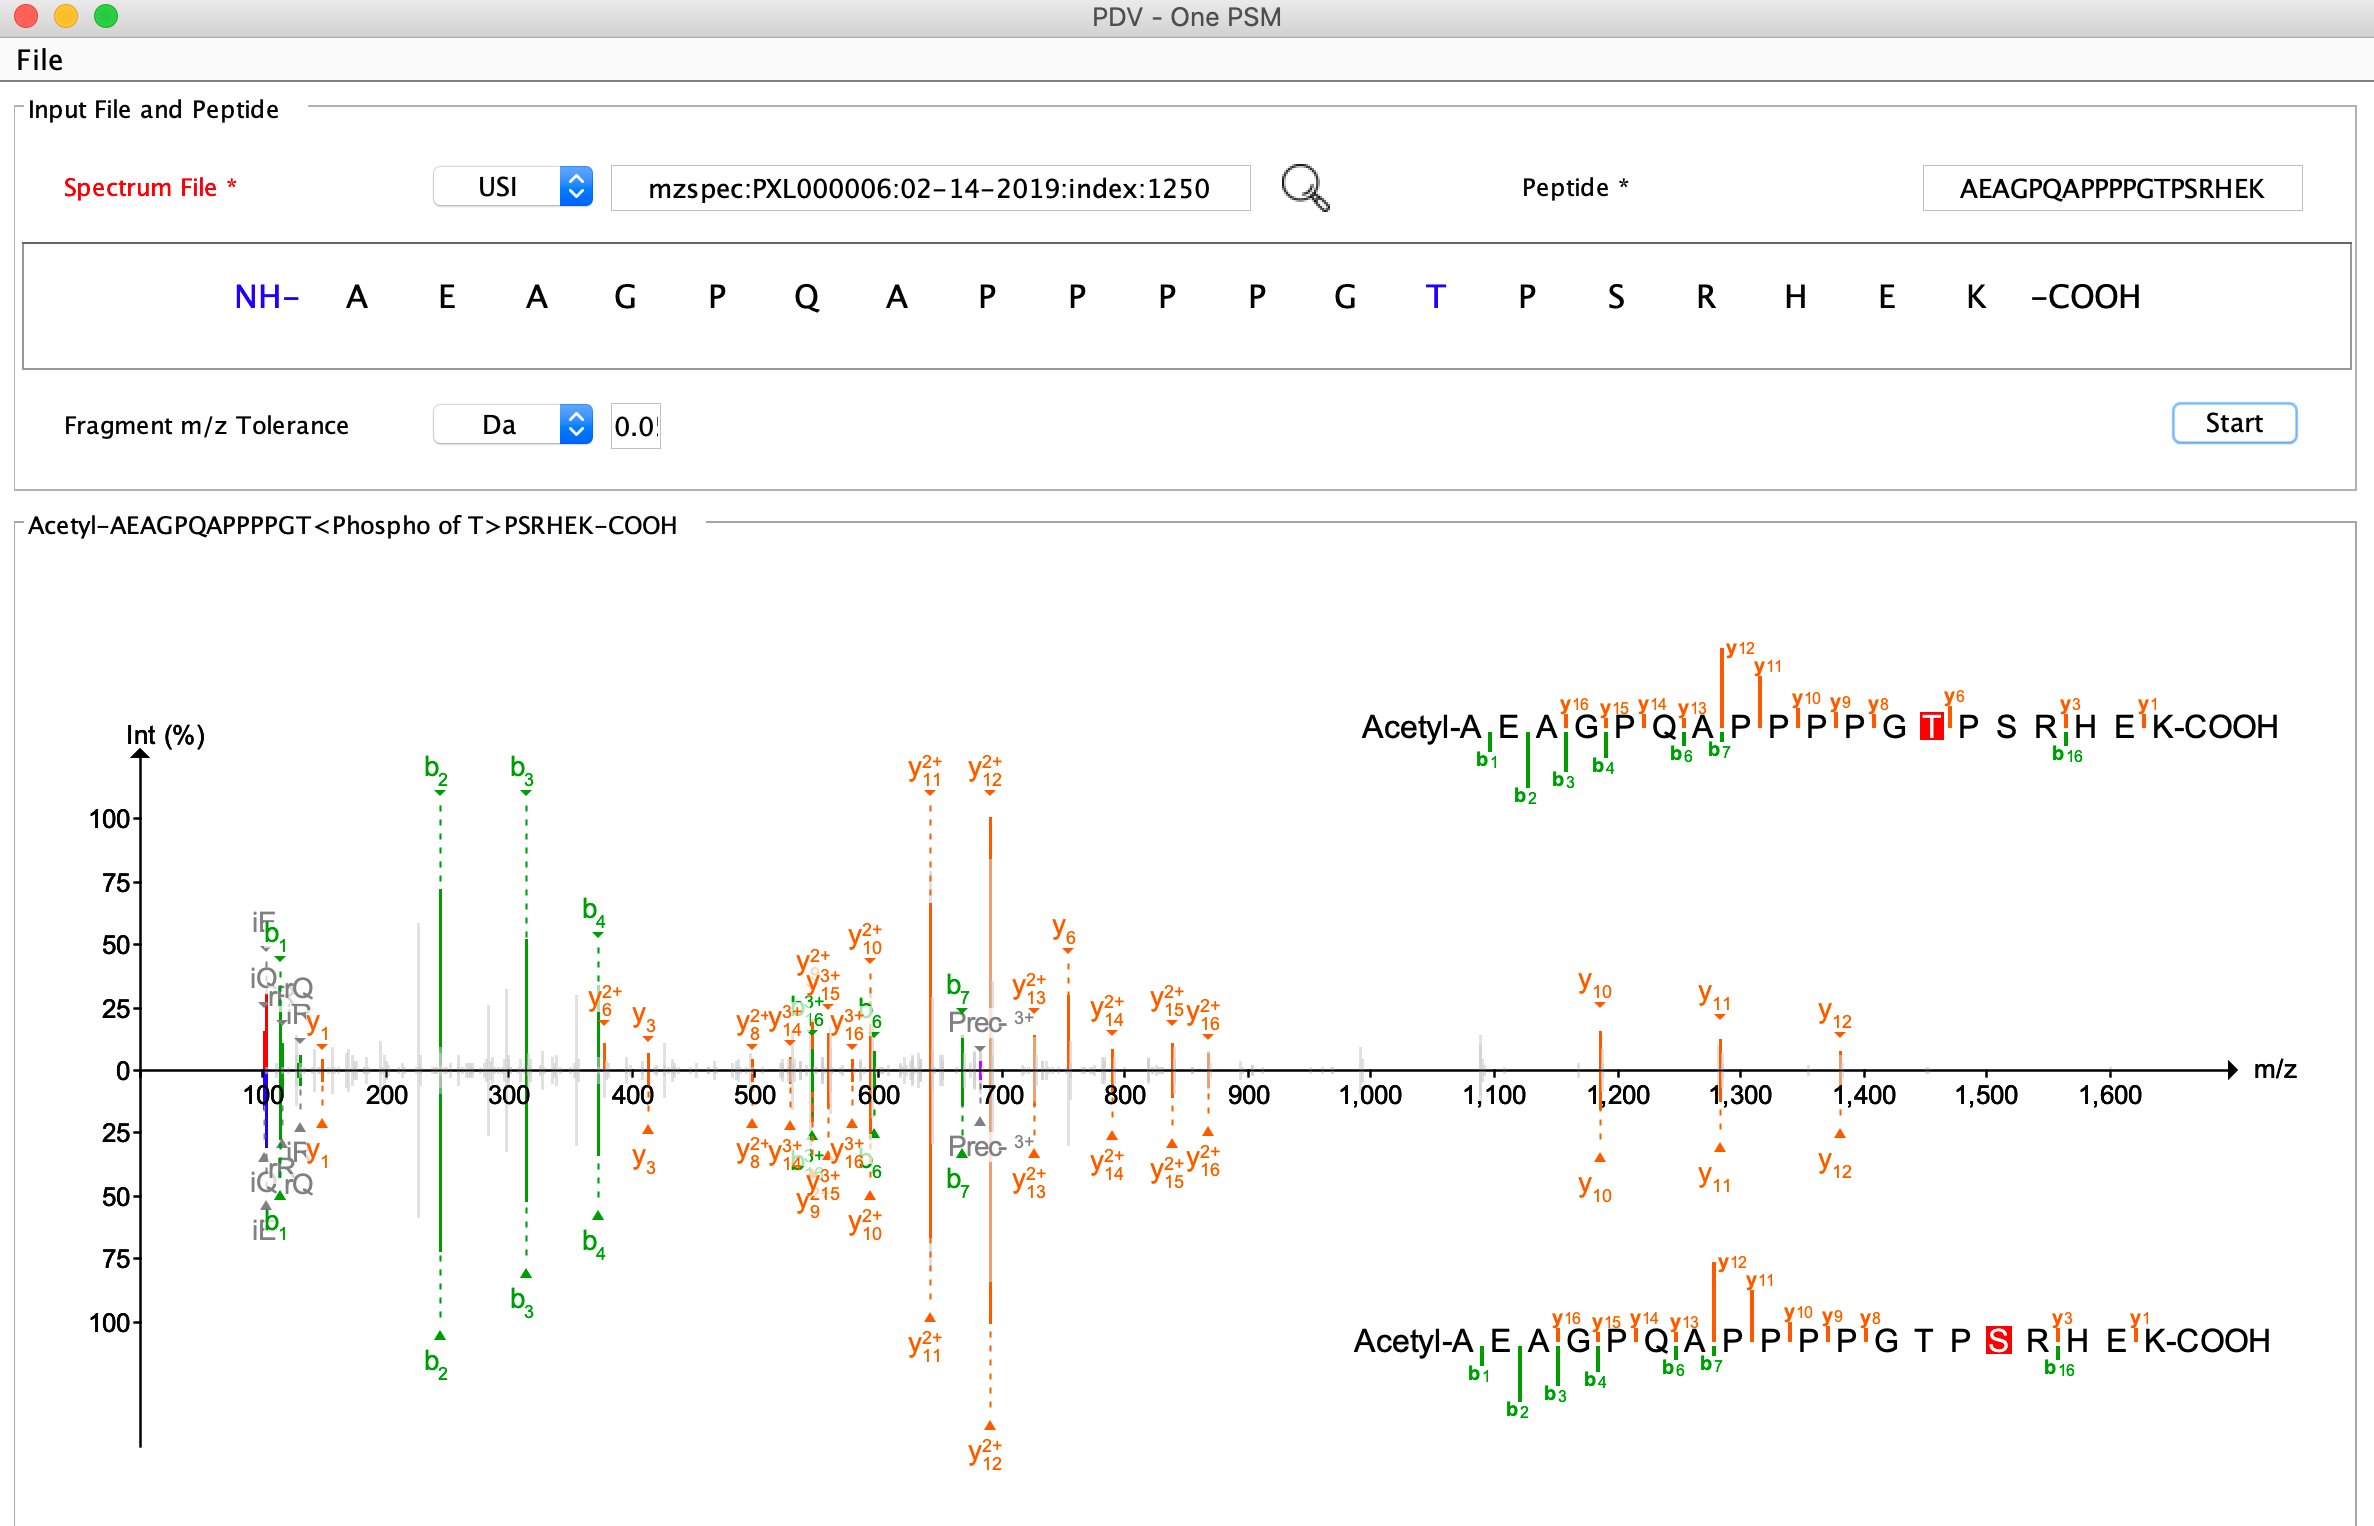
PDV is a lightweight visualization tool that enables intuitive and fast exploration of diverse, large-scale proteomics datasets in different formats on standard desktop computers in both graphical user interface and command line modes. One of the most important functions of PDV is to visualize peptide identification results from different search engines and generate high quality annotated spectra for publication.

A user's manual is available at http://pdv.zhang-lab.org. You can find some visualization examples in the user's manual or the manuscript of PDV.
The PDV package can be downloaded at https://github.com/wenbostar/PDV/releases.
PDV supports visualizing N-linked intact glycopeptide identification result (identification file: psm.tsv, MS/MS file: mzML format) generated by MSFragger-Glyco/Philosopher. An example input can be downloaded at MSFragger-Glyco_example.
USI (Universal Spectrum Identifier)
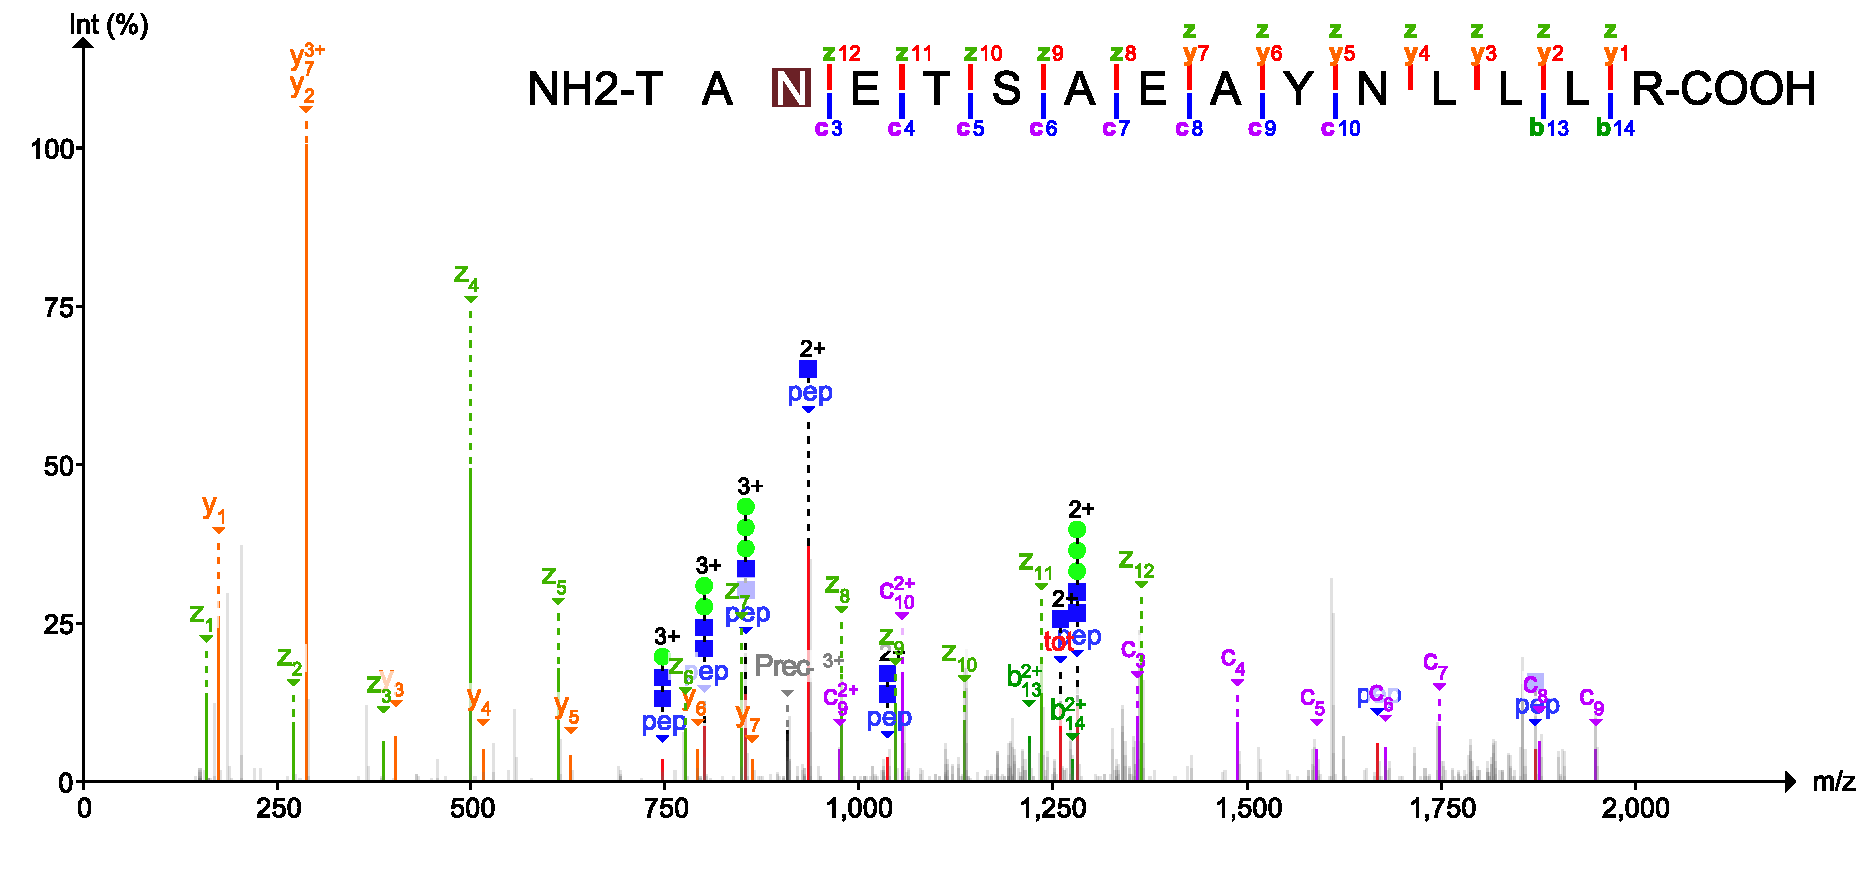
Mirror plot (Experimental spectrum VS predicted spectrum using deep learning)
Top panel: experimental spectrum, bottom panel: predicted spectrum using deep learning.

| Software | Example files |
|---|---|
| Casanovo | Manual |
| Novor | mgf:csv (only support the Novor result generated through DeNovoGUI) |
| DeepNovo | mgf:txt |
| PepNovo+ | mgf:txt |
| pNovo+ | mgf:txt |
| Type | Example files |
|---|---|
| proBAM | ProBAM.tar.gz |
| proBed | ProBed.tar.gz |
Spectrum Library Central at PeptideAtlas
| Type | Example files |
|---|---|
| mzML | SF_200217_U2OS_TiO2_HCD_OT_rep1.mzML.gz |
| mzXML | SF_200217_U2OS_TiO2_HCD_OT_rep1.mzXML.gz |
PRIDE_Exp_Complete_Ac_22028.xml.gz
Please find an example in this tutorial: QC analysis.
PDV provides a command line module to produce figures of annotated spectra or TIC in batch mode. It can be used to generate figures according to a list of peptide sequences or a list of spectrum indexes.
$ java -jar PDV-1.1.0/PDV-1.1.0.jar -husage: Options
-a <arg> Error window for MS/MS fragment ion mass values. Unit is Da.
The default value is 0.5.
-ah Whether or not to consider neutral loss of H2O.
-an Whether or not to consider neutral loss of NH3.
-c <arg> The intensity percentile to consider for annotation. Default
is 3 (3%), it means that the peaks with intensities >= (3% *
max intensity) will be annotated.
-fh <arg> Figure height. Default is 400
-ft <arg> Figure type. Can be png, pdf or tiff.
-fu <arg> The units in which ‘height’(fh) and ‘width’(fw) are given.
Can be cm, mm or px. Default is px
-fw <arg> Figure width. Default is 800
-h Help
-help Help
-i <arg> A file containing peptide sequences or spectrum IDs. PDV will
generate figures for these peptides or spectra.
-k <arg> The input data type for parameter -i (Spectrum ID: s, peptide
sequence: p).
-o <arg> Output directory.
-pw <arg> Peak width. Default is 1
-r <arg> Identification file.
-rt <arg> Identification file format (mzIdentML: 1, pepXML: 2, proBAM:
3, txt: 4, maxQuant: 5, TIC: 6).
-s <arg> MS/MS data file
-st <arg> MS/MS data format (mgf: 1, mzML: 2, mzXML: 3).
Please find a few examples below. Please download the example data here: input_data.tar.gz
(1) Input: mgf and mzID
java -jar PDV-1.1.0/PDV-1.1.0.jar -r input_data/SF_200217_U2OS_TiO2_HCD_OT_rep1_myrimatch_mgf.mzid -rt 1 -s input_data/SF_200217_U2OS_TiO2_HCD_OT_rep1.mgf -st 1 -i input_data/spectrum_title.txt -k s -o output -a 0.05 -c 3 -pw 1 -fw 800 -fh 400 -fu px -ft pdf(2) Input: mzML and mzID
java -jar PDV-1.1.0/PDV-1.1.0.jar -r input_data/SF_200217_U2OS_TiO2_HCD_OT_rep1_myrimatch_mzML.mzid -rt 1 -s input_data/SF_200217_U2OS_TiO2_HCD_OT_rep1.mzML -st 2 -i input_data/spectrum_scan_number.txt -k s -o output -a 0.05 -c 3 -pw 1 -fw 800 -fh 400 -fu px -ft pdf
(3) Input: mgf and pepXML
java -jar PDV-1.1.0/PDV-1.1.0.jar -r input_data/SF_200217_U2OS_TiO2_HCD_OT_rep1_myrimatch_mgf.pepXML -rt 2 -s input_data/SF_200217_U2OS_TiO2_HCD_OT_rep1.mgf -st 1 -i input_data/spectrum_title.txt -k s -o output -a 0.05 -c 3 -pw 1 -fw 800 -fh 400 -fu px -ft pdf
(4) Input mzML and pepXML
java -jar PDV-1.1.0/PDV-1.1.0.jar -r input_data/SF_200217_U2OS_TiO2_HCD_OT_rep1_myrimatch_mzML.pepXML -rt 2 -s input_data/SF_200217_U2OS_TiO2_HCD_OT_rep1.mzML -st 2 -i input_data/spectrum_scan_number.txt -k s -o output -a 0.05 -c 3 -pw 1 -fw 800 -fh 400 -fu px -ft pdf
To cite the PDV package in publications, please use:
Li, K., et al. "PDV: an integrative proteomics data viewer." Bioinformatics, Volume 35, Issue 7, 01 April 2019, Pages 1249–1251. https://doi.org/10.1093/bioinformatics/bty770
PDV has been cited or used in the following manuscripts:
- Wang X, Codreanu S G, Wen B, et al. Detection of proteome diversity resulted from alternative splicing is limited by trypsin cleavage specificity. Molecular & Cellular Proteomics, 2017: mcp. RA117. 000155.
- Menschaert G, Wang X, Jones A R, et al. The proBAM and proBed standard formats: enabling a seamless integration of genomics and proteomics data. Genome biology, 2018, 19(1): 12.
- Wen, Bo, Xiaojing Wang, and Bing Zhang. "PepQuery enables fast, accurate, and convenient proteomic validation of novel genomic alterations." Genome research 29.3 (2019): 485-493.
- Rong, Mingqiang, et al. "PPIP: Automated Software for Identification of Bioactive Endogenous Peptides." Journal of proteome research 18.2 (2018): 721-727.
- Zhang X, Huang H, He Y, et al. High-throughput identification of heavy metal binding proteins from the byssus of chinese green mussel (Perna viridis) by combination of transcriptome and proteome sequencing. PloS one, 2019, 14(5): e0216605.
- Ren, Zhe, et al. "Improvements to the Rice Genome Annotation Through Large-Scale Analysis of RNA-Seq and Proteomics Data Sets." Molecular & Cellular Proteomics 18.1 (2019): 86-98.
Contributions to the package are more than welcome.