This is a web-based app that I developed with Dash framework and Python in 2021 as one of the projects in the Artificial Intelligence Graduate Program at the University of San Diego. The objective is to use the dataset from diabetes labs to train a Machine Learning model to predict diabetes based on diagnostic measurements. The app allows you to pick between six different algorithms as your classifier model; in addition, it can find the algorithm with the best performance for your data.
We can use the historical diagnostic data of the patients who were tested for diabetes in order to calculate the risk of diabetes for other patients. The application performs diabetes diagnosis based on the patient’s other lab measurements, it allows the technician to choose between six classification algorithms with the fine tuned hyperparameters for the best performance. The application uses the models to classify the record either as ‘Diabetes’ or ‘None Diabetes’ depending on the probability value of the prediction. In addition, it also shows the performance analytics of the selected model based on its predictions on the test data; these analytics indicate how well the model is trained, and hence how accurate and reliable the prediction is on the sample record. The technician can perform the prediction with different models and choose the prediction result that comes with the best model performance.
The Application consists of three sections:
The top section allows the user to select a model, pick the number of training data and click on Train button, then the model starts training, and shows the best hyperparameter values computed by the Grid search algorithm:

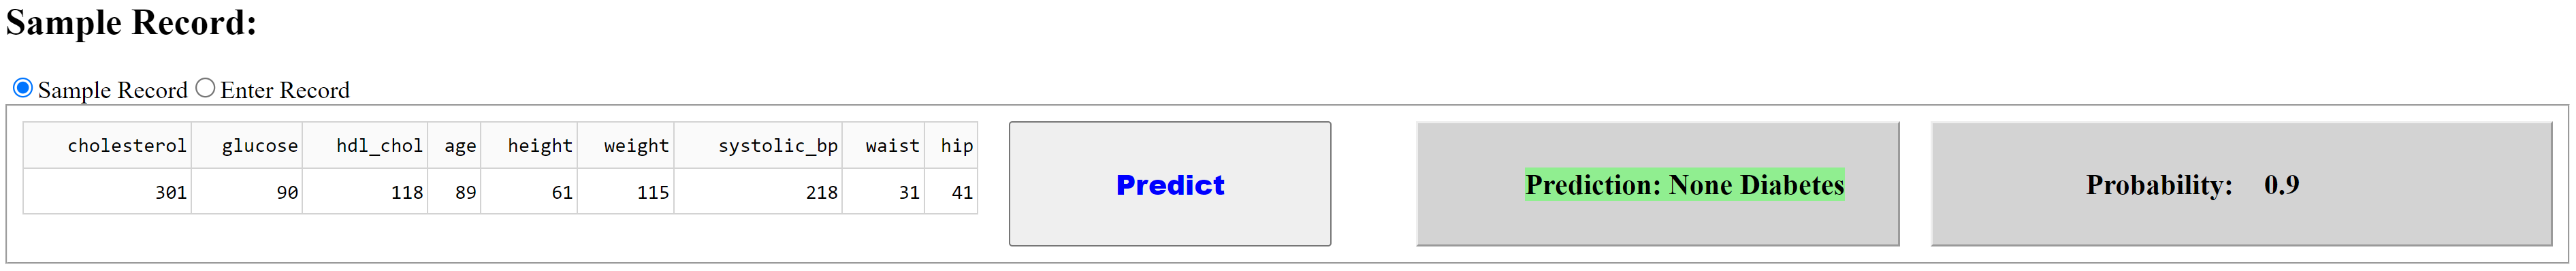
This section shows a sample record that was randomly picked from the dataset, the user can edit the values or enter a new input, and then click on the Predict button, and then the trained model will perform the classification on this test data:
The bottom section corresponds to the performance of the trained model, the first panel shows three performance scores, which are calculated based on the predictions on the test data. The confusion matrix is also provided, which upon hovering on each box, shows the count of true or false predictions on the test data. The pie chart on the right shows the same data in percentage, so the user can see the fractions of the prediction results:

- Logistic Regression
- KNN
- Naive Bayes
- Decision Tree
- Random Forest
- Gradient Boosting
- Grid search
- Python
- Dash
- Numpy
- Scikit-learn
- Pandas
- Matplotlib
The application is created by Dash framework in python, the file “my_diabetesp-prediction-app.py” contains the whole code including both the logic and the layout of the app. To run the app, first download the files, and we just need to run the below python command, and then the app will be serving in the localhost. (We also need to set the path of the csv file) Python predict-diabetes-app.py
This dataset was downloaded from data.world which came from the Biostatistics program at Vanderbilt. The downloaded dataset contains 390 instances (patients) including 60 instances are diabetes and the remaining 330 are not diabetes.