View Kafka broker metrics collected for a 360-view of the health and performance of your Kafka clusters in real time. With this integration, you can collect metrics and logs from your Kafka deployment to visualize telemetry and alert on the performance of your Kafka stack.
Note:
- This check has a limit of 350 metrics per instance. The number of returned metrics is indicated in the Agent status output. Specify the metrics you are interested in by editing the configuration below. For more detailed instructions on customizing the metrics to collect, see the JMX Checks documentation.
- This integration attached sample configuration works only for Kafka >= 0.8.2. If you are running a version older than that, see the Agent v5.2.x released sample files.
- To collect Kafka consumer metrics, see the kafka_consumer check.
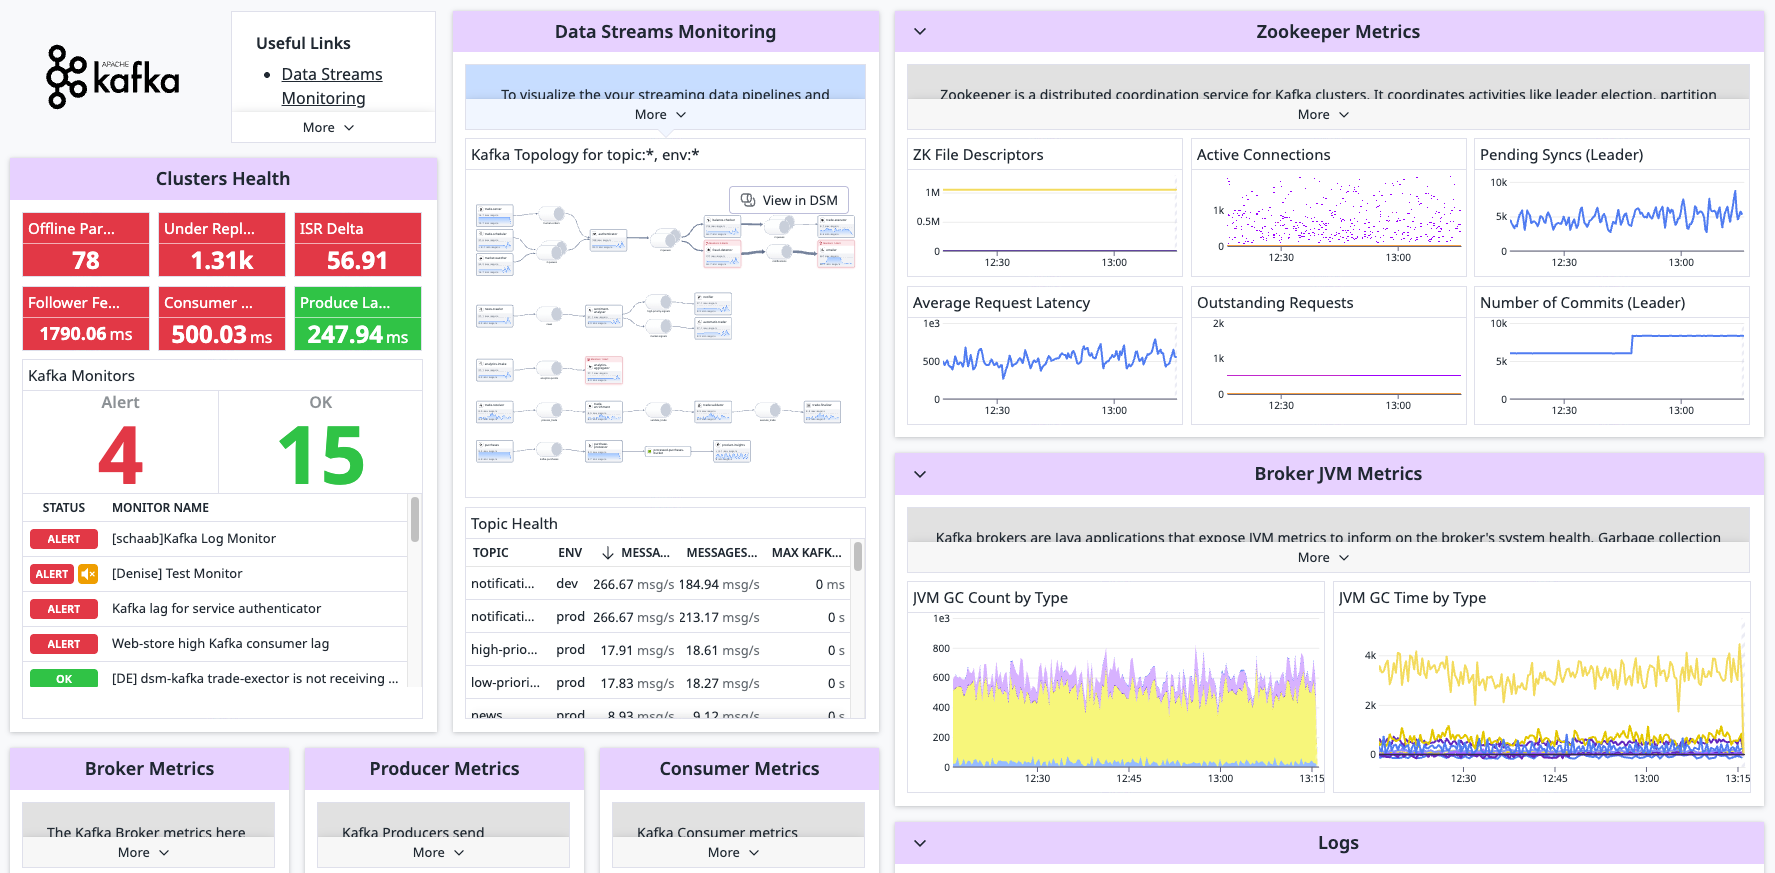
Consider Data Streams Monitoring to enhance your Kafka integration. This solution enables pipeline visualization and lag tracking, helping you identify and resolve bottlenecks.
The Agent's Kafka check is included in the Datadog Agent package, so you don't need to install anything else on your Kafka nodes.
The check collects metrics from JMX with JMXFetch. A JVM is needed on each kafka node so the Agent can run JMXFetch. The same JVM that Kafka uses can be used for this.
Note: The Kafka check cannot be used with Managed Streaming for Apache Kafka (Amazon MSK). Use the Amazon MSK integration instead.
To configure this check for an Agent running on a host:
-
Edit the
kafka.d/conf.yamlfile, in theconf.d/folder at the root of your Agent's configuration directory. Kafka bean names depend on the exact Kafka version you're running. Use the example configuration file that comes packaged with the Agent as a base since it is the most up-to-date configuration. Note: the Agent version in the example may be for a newer version of the Agent than what you have installed.
Available for Agent versions >6.0
-
Kafka uses the
log4jlogger by default. To activate logging to a file and customize the format edit thelog4j.propertiesfile:# Set root logger level to INFO and its only appender to R log4j.rootLogger=INFO, R log4j.appender.R.File=/var/log/kafka/server.log log4j.appender.R.layout=org.apache.log4j.PatternLayout log4j.appender.R.layout.ConversionPattern=%d{yyyy-MM-dd HH:mm:ss} %-5p %c{1}:%L - %m%n -
By default, the Datadog integration pipeline supports the following conversion patterns:
  %d{yyyy-MM-dd HH:mm:ss} %-5p %c{1}:%L - %m%n
  %d [%t] %-5p %c - %m%n
  %r [%t] %p %c %x - %m%n
  [%d] %p %m (%c)%n
Clone and edit the integration pipeline if you have a different format.
-
Collecting logs is disabled by default in the Datadog Agent, enable it in your
datadog.yamlfile:logs_enabled: true
-
Add the following configuration block to your
kafka.d/conf.yamlfile. Change thepathandserviceparameter values based on your environment. See the sample kafka.d/conf.yaml for all available configuration options.logs: - type: file path: /var/log/kafka/server.log source: kafka service: myapp #To handle multi line that starts with yyyy-mm-dd use the following pattern #log_processing_rules: # - type: multi_line # name: log_start_with_date # pattern: \d{4}\-(0?[1-9]|1[012])\-(0?[1-9]|[12][0-9]|3[01])
For containerized environments, see the Autodiscovery with JMX guide.
Available for Agent versions >6.0
Collecting logs is disabled by default in the Datadog Agent. To enable it, see Kubernetes Log Collection.
| Parameter | Value |
|---|---|
<LOG_CONFIG> |
{"source": "kafka", "service": "<SERVICE_NAME>"} |
Run the Agent's status subcommand and look for kafka under the JMXFetch section:
========
JMXFetch
========
  Initialized checks
  ==================
    kafka
      instance_name : kafka-localhost-9999
      message :
      metric_count : 46
      service_check_count : 0
      status : OK
See metadata.csv for a list of metrics provided by this check.
The Kafka check does not include any events.
See service_checks.json for a list of service checks provided by this integration.