This Agent check collects metrics from Mesos slaves for:
- System load
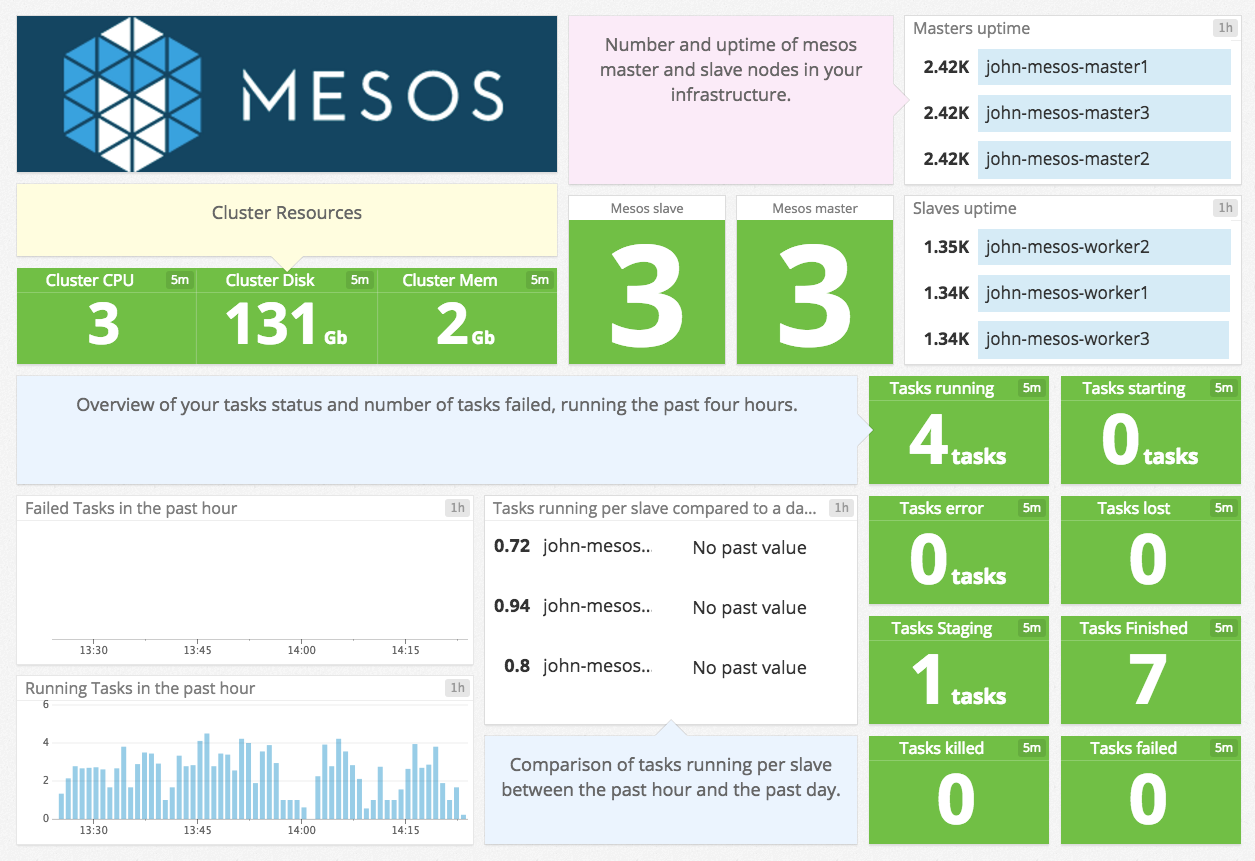
- Number of tasks failed, finished, staged, running, etc
- Number of executors running, terminated, etc
And many more.
This check also creates a service check for every executor task.
See Installing Datadog on Mesos with DC/OS to install the Datadog Agent on each Mesos agent node with the DC/OS web UI.
- In the DC/OS web UI, click on the Universe tab. Find the datadog package and click the Install button.
- Click the Advanced Installation button.
- Enter your Datadog API Key in the first field.
- In the Instances field, enter the number of slave nodes in your cluster (You can determine the number of nodes in your cluster by clicking the Nodes tab on the left side of the DC/OS web ui).
- Click Review and Install then Install
If you are not using DC/OS, use the Marathon web UI or post to the API URL the following JSON to define the Datadog Agent. You must change <YOUR_DATADOG_API_KEY> with your API Key and the number of instances with the number of slave nodes on your cluster. You may also need to update the docker image used to more recent tag. You can find the latest on Docker Hub
{
  "id": "/datadog-agent",
  "cmd": null,
  "cpus": 0.05,
  "mem": 256,
  "disk": 0,
  "instances": 1,
  "constraints": [
    ["hostname", "UNIQUE"],
    ["hostname", "GROUP_BY"]
  ],
  "acceptedResourceRoles": ["slave_public", "*"],
  "container": {
    "type": "DOCKER",
    "volumes": [
      {
        "containerPath": "/var/run/docker.sock",
        "hostPath": "/var/run/docker.sock",
        "mode": "RO"
      },
      { "containerPath": "/host/proc", "hostPath": "/proc", "mode": "RO" },
      {
        "containerPath": "/host/sys/fs/cgroup",
        "hostPath": "/sys/fs/cgroup",
        "mode": "RO"
      }
    ],
    "docker": {
      "image": "datadog/agent:latest",
      "network": "BRIDGE",
      "portMappings": [
        {
          "containerPort": 8125,
          "hostPort": 8125,
          "servicePort": 10000,
          "protocol": "udp",
          "labels": {}
        }
      ],
      "privileged": false,
      "parameters": [
        { "key": "name", "value": "datadog-agent" },
        { "key": "env", "value": "DD_API_KEY=<YOUR_DATADOG_API_KEY>" },
        { "key": "env", "value": "MESOS_SLAVE=true" }
      ],
      "forcePullImage": false
    }
  },
  "healthChecks": [
    {
      "protocol": "COMMAND",
      "command": { "value": "/probe.sh" },
      "gracePeriodSeconds": 300,
      "intervalSeconds": 60,
      "timeoutSeconds": 20,
      "maxConsecutiveFailures": 3
    }
  ],
  "portDefinitions": [
    { "port": 10000, "protocol": "tcp", "name": "default", "labels": {} },
    { "port": 10001, "protocol": "tcp", "labels": {} }
  ]
}
Unless you want to configure a custom mesos_slave.d/conf.yaml-perhaps you need to set disable_ssl_validation: true-you don't need to do anything after installing the Agent.
-
Collecting logs is disabled by default in the Datadog Agent, enable it in your
datadog.yamlfile:logs_enabled: true
-
Add this configuration block to your
mesos_slave.d/conf.yamlfile to start collecting your Mesos logs:logs: - type: file path: /var/log/mesos/* source: mesos
Change the
pathparameter value based on your environment, or use the default docker stdout:logs: - type: docker source: mesos
See the sample mesos_slave.d/conf.yaml for all available configuration options.
To enable logs for Kubernetes environments, see Kubernetes Log Collection.
Under the Services tab in the DC/OS web UI you should see the Datadog Agent shown. In Datadog, search for mesos.slave in the Metrics Explorer.
If you are not using DC/OS, then datadog-agent is in the list of running applications with a healthy status. In Datadog, search for mesos.slave in the Metrics Explorer.
See metadata.csv for a list of metrics provided by this integration.
The Mesos-slave check does not include any events.
See service_checks.json for a list of service checks provided by this integration.
Need help? Contact Datadog support.