This page only documents how to ingest Spark metrics and logs.
This check monitors Spark through the Datadog Agent. Collect Spark metrics for:
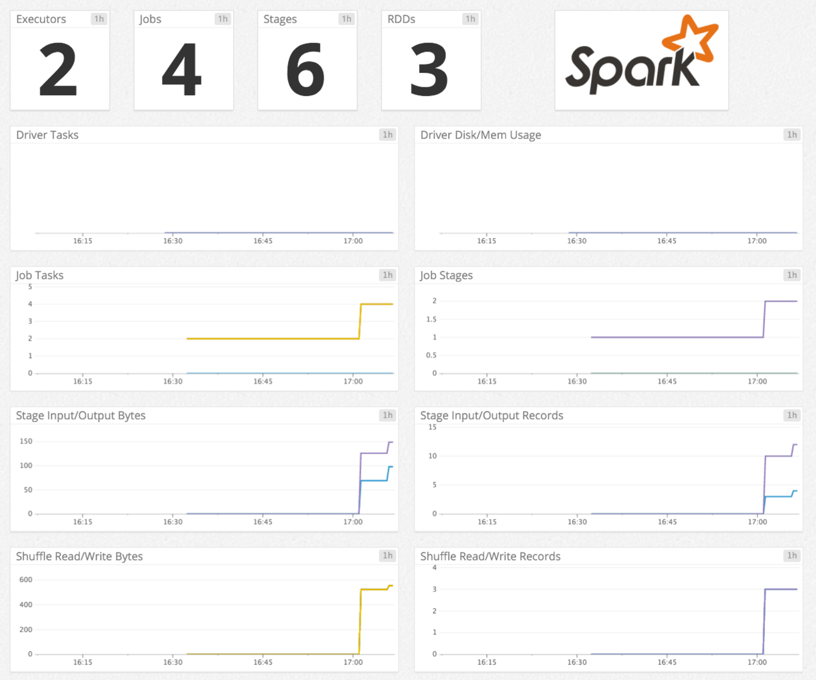
- Drivers and executors: RDD blocks, memory used, disk used, duration, etc.
- RDDs: partition count, memory used, and disk used.
- Tasks: number of tasks active, skipped, failed, and total.
- Job state: number of jobs active, completed, skipped, and failed.
The Spark check is included in the Datadog Agent package. No additional installation is needed on your Mesos master (for Spark on Mesos), YARN ResourceManager (for Spark on YARN), or Spark master (for Spark Standalone).
To configure this check for an Agent running on a host:
-
Edit the
spark.d/conf.yamlfile, in theconf.d/folder at the root of your Agent's configuration directory. The following parameters may require updating. See the sample spark.d/conf.yaml for all available configuration options.init_config: instances: - spark_url: http://localhost:8080 # Spark master web UI # spark_url: http://<Mesos_master>:5050 # Mesos master web UI # spark_url: http://<YARN_ResourceManager_address>:8088 # YARN ResourceManager address spark_cluster_mode: spark_yarn_mode # default # spark_cluster_mode: spark_mesos_mode # spark_cluster_mode: spark_yarn_mode # spark_cluster_mode: spark_driver_mode # required; adds a tag 'cluster_name:<CLUSTER_NAME>' to all metrics cluster_name: "<CLUSTER_NAME>" # spark_pre_20_mode: true # if you use Standalone Spark < v2.0 # spark_proxy_enabled: true # if you have enabled the spark UI proxy
For containerized environments, see the Autodiscovery Integration Templates for guidance on applying the parameters below.
| Parameter | Value |
|---|---|
<INTEGRATION_NAME> |
spark |
<INIT_CONFIG> |
blank or {} |
<INSTANCE_CONFIG> |
{"spark_url": "%%host%%:8080", "cluster_name":"<CLUSTER_NAME>"} |
-
Collecting logs is disabled by default in the Datadog Agent, enable it in your
datadog.yamlfile:logs_enabled: true
-
Uncomment and edit the logs configuration block in your
spark.d/conf.yamlfile. Change thetype,path, andserviceparameter values based on your environment. See the sample spark.d/conf.yaml for all available configuration options.logs: - type: file path: <LOG_FILE_PATH> source: spark service: <SERVICE_NAME> # To handle multi line that starts with yyyy-mm-dd use the following pattern # log_processing_rules: # - type: multi_line # pattern: \d{4}\-(0?[1-9]|1[012])\-(0?[1-9]|[12][0-9]|3[01]) # name: new_log_start_with_date
To enable logs for Docker environments, see Docker Log Collection.
Run the Agent's status subcommand and look for spark under the Checks section.
See metadata.csv for a list of metrics provided by this check.
The Spark check does not include any events.
See service_checks.json for a list of service checks provided by this integration.
To receive metrics for Spark on AWS EMR, use bootstrap actions to install the Datadog Agent:
For Agent v5, create the /etc/dd-agent/conf.d/spark.yaml configuration file with the proper values on each EMR node.
For Agent v6/7, create the /etc/datadog-agent/conf.d/spark.d/conf.yaml configuration file with the proper values on each EMR node.
The Spark integration only collects metrics about running apps. If you have no currently running apps, the check will just submit a health check.
Additional helpful documentation, links, and articles: