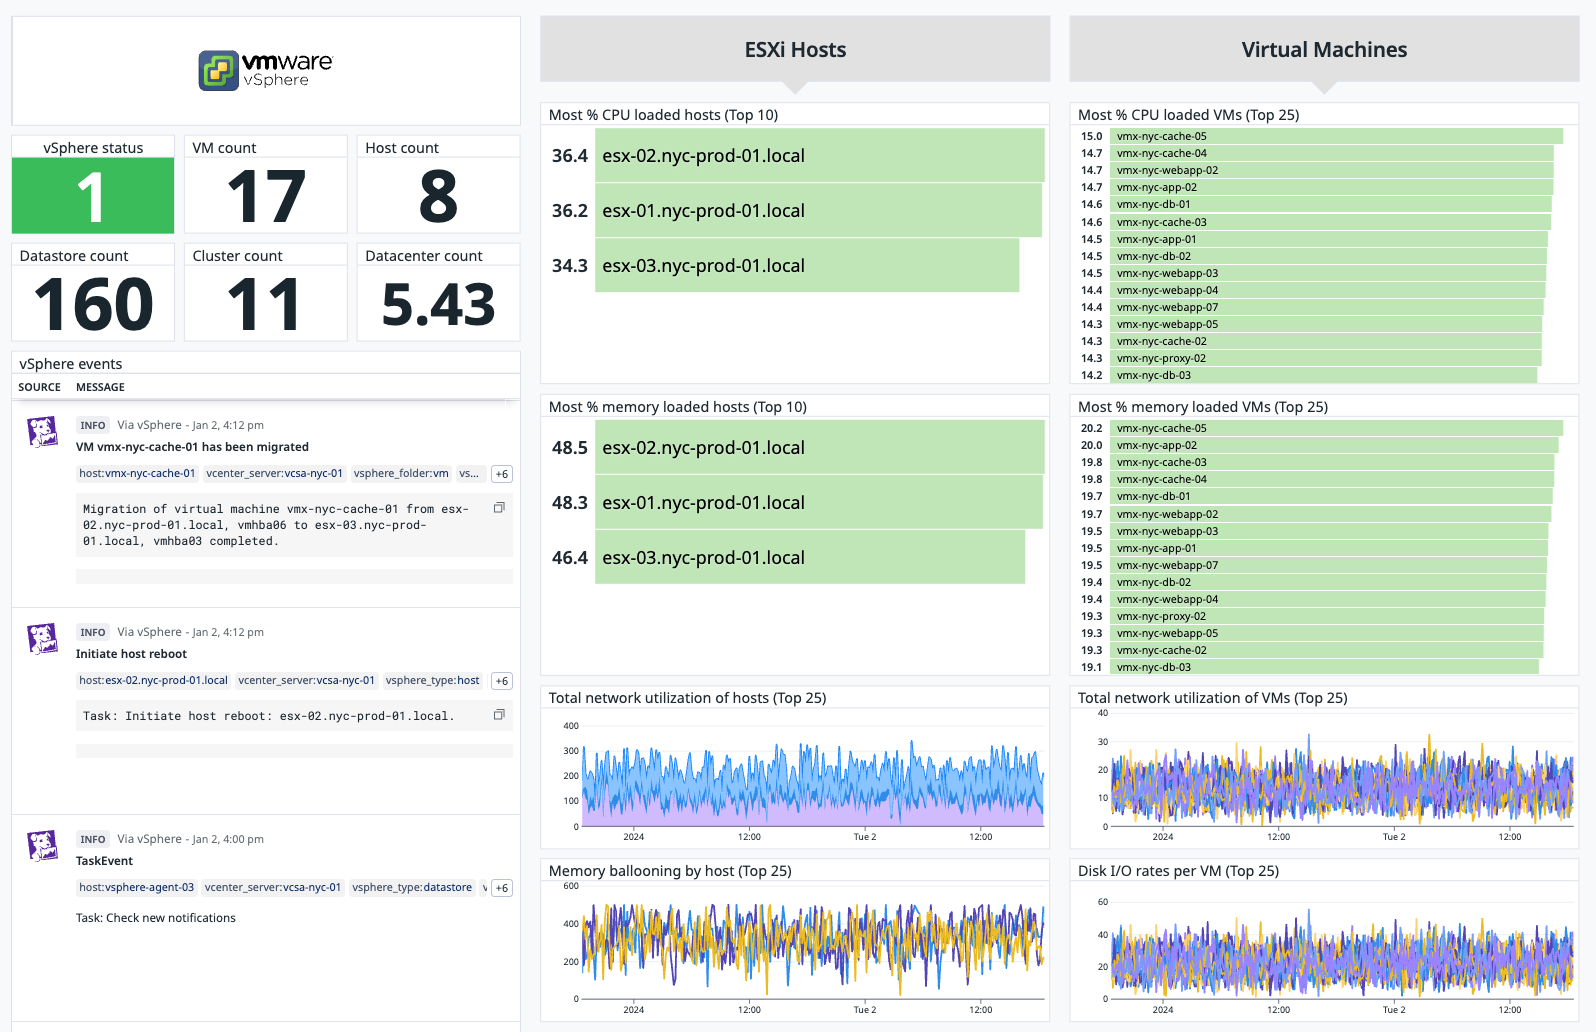
This check collects resource usage metrics from your vSphere cluster-CPU, disk, memory, and network usage. It also watches your vCenter server for events and emits them to Datadog.
The vSphere check is included in the Datadog Agent package, so you don't need to install anything else on your vCenter server.
In the Administration section of vCenter, add a read-only user called datadog-readonly and apply the read-only user permissions to the resources that need monitoring. To monitor all child objects in the resource hierarchy, select the "Propagate to children" option.
Then, edit the vsphere.d/conf.yaml file in the conf.d/ folder at the root of your Agent's configuration directory. See the sample vsphere.d/conf.yaml for all available configuration options.
Restart the Agent to start sending vSphere metrics and events to Datadog.
Note: The Datadog Agent doesn't need to be on the same server as the vSphere appliance software. An Agent with the vSphere check enabled can be set up to point to a vSphere appliance server. Update your <HOSTNAME> for each instance accordingly.
Starting with v5.0.0 of the check, shipped in Agent v6.18.0/7.18.0, a new implementation was introduced which required changes to the configuration file. To preserve backwards compatibility, a configuration parameter called use_legacy_check_version was temporarily introduced.
If you are upgrading from an older version of the integration, this parameter is unset in the config and forces the Agent to use the older implementation.
If you are configuring the integration for the first time or if you want to benefit from the new features (like tag collection and advanced filtering options), see the sample vsphere.d/conf.yaml configuration file. In particular, make sure to set use_legacy_check_version: false.
Run the Agent's status subcommand and look for vsphere under the Checks section.
Depending of the collection_level value you set in your check configuration, not all metrics below are collected. See Data Collection Levels to display metrics collected for a given collection.
See metadata.csv for a list of metrics provided by this check.
Note: The vSphere integration has the ability to collect both per-resource metrics (such as those related to CPUs), and per-instance metrics (such as those related to CPU cores). As such, there are metrics that are only per-resource, per-instance, or both. A resource represents a physical or virtual representation of a machine. This can be represented by vm, host, datastore, cluster in vSphere. An instance represents individual entities found within a resource. More information on vSphere resources can be found in the VMWare Infrastructure Architecture Overview white paper.
By default, the vSphere integration only collects per-resource metrics, which causes some metrics that are per-instance to be ignored. These can be configured using the collect_per_instance_filters option. See below for an example:
collect_per_instance_filters:
  host:
    - 'disk\.totalLatency\.avg'
    - 'disk\.deviceReadLatency\.avg'
disk metrics are specific for each disk on the host, therefore these metrics need to be enabled using collect_per_instance_filters to be collected.
The vSphere integration can also collect property-based metrics. These are configuration properties, such as if a host is in maintenance mode or a cluster is configured with DRS.
To enable property metrics, configure the following option:
collect_property_metrics: true
Property metrics are prefixed by the resource name. For example, host property metrics are prefixed with vsphere.host.*, and VM property metrics are prefixed with vsphere.vm.*. View all the possible property metrics in the metadata.csv.
This check watches vCenter's Event Manager for events and emits them to Datadog. The check defaults to emit the following event types:
- AlarmStatusChangedEvent
- VmBeingHotMigratedEvent
- VmReconfiguredEvent
- VmPoweredOnEvent
- VmMigratedEvent
- TaskEvent
- VmMessageEvent
- VmSuspendedEvent
- VmPoweredOffEvent
Use the include_events parameter section in the sample vsphere.d/conf.yaml to collect additional events from the vim.event class .
See service_checks.json for a list of service checks provided by this integration.
You can limit the number of VMs pulled in with the VMWare integration using the vsphere.d/conf.yaml file. See the resource_filters parameter section in the sample vsphere.d/conf.yaml.
The Datadog vSphere integration collects metrics and events from your TKG VMs and control plane VMs automatically. To collect more granular information about your TKG cluster, including container-, pod-, and node-level metrics, you can install the Datadog Agent on your cluster. See the distribution documentation for example configuration files specific to TKG.
