This check collects metrics from your YARN ResourceManager, including (but not limited to):
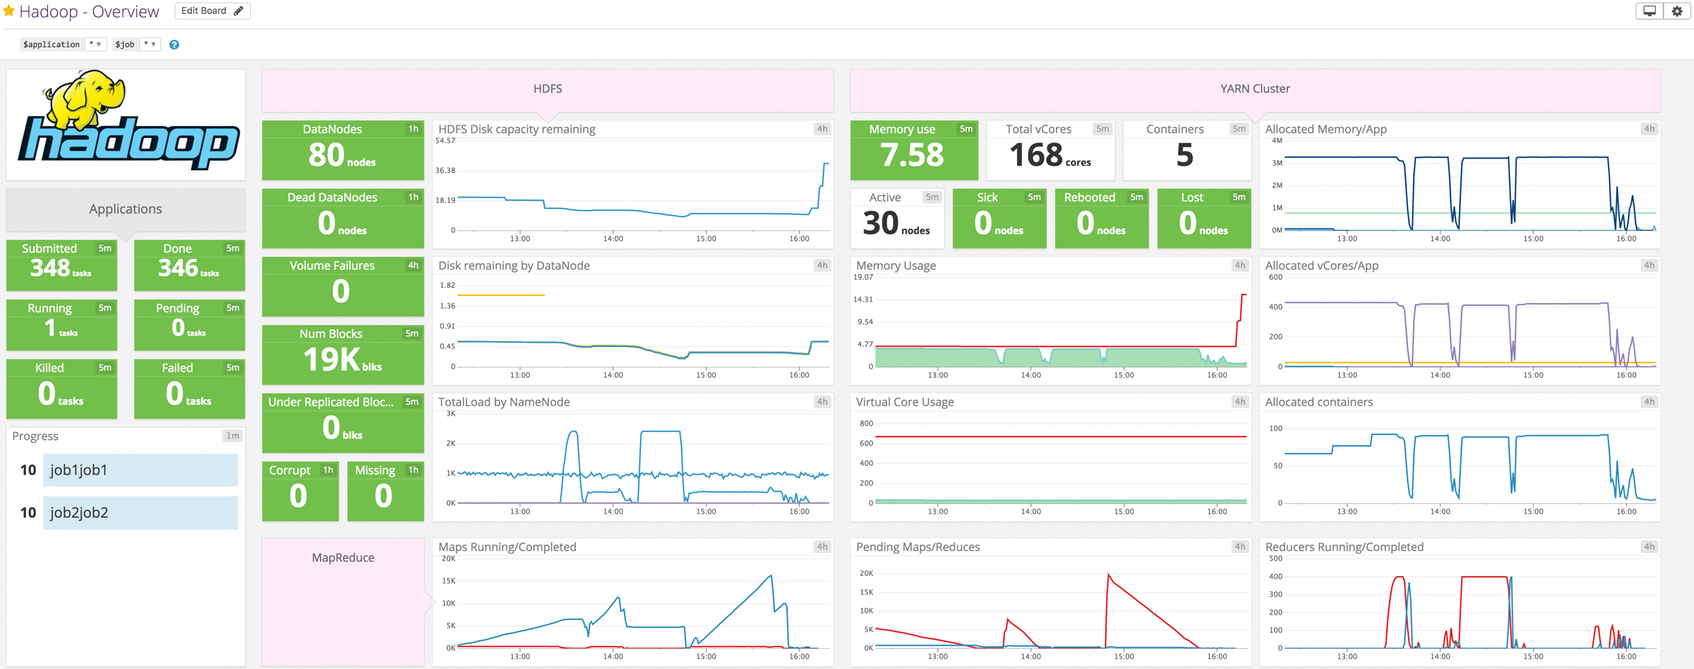
- Cluster-wide metrics, such as number of running apps, running containers, unhealthy nodes, and more.
- Per-application metrics, such as app progress, elapsed running time, running containers, memory use, and more.
- Node metrics, such as available vCores, time of last health update, and more.
yarn.apps.<METRIC> metrics are deprecated in favor of yarn.apps.<METRIC>_gauge metrics because yarn.apps metrics are incorrectly reported as a RATE instead of a GAUGE.
The YARN check is included in the Datadog Agent package, so you don't need to install anything else on your YARN ResourceManager.
To configure this check for an Agent running on a host:
-
Edit the
yarn.d/conf.yamlfile in theconf.d/folder at the root of your Agent's configuration directory.init_config: instances: ## @param resourcemanager_uri - string - required ## The YARN check retrieves metrics from YARNS's ResourceManager. This ## check must be run from the Master Node and the ResourceManager URI must ## be specified below. The ResourceManager URI is composed of the ## ResourceManager's hostname and port. ## The ResourceManager hostname can be found in the yarn-site.xml conf file ## under the property yarn.resourcemanager.address ## ## The ResourceManager port can be found in the yarn-site.xml conf file under ## the property yarn.resourcemanager.webapp.address # - resourcemanager_uri: http://localhost:8088 ## @param cluster_name - string - required - default: default_cluster ## A friendly name for the cluster. # cluster_name: default_cluster
See the example check configuration for a comprehensive list and description of all check options.
-
Restart the Agent to start sending YARN metrics to Datadog.
For containerized environments, see the Autodiscovery Integration Templates for guidance on applying the parameters below.
| Parameter | Value |
|---|---|
<INTEGRATION_NAME> |
yarn |
<INIT_CONFIG> |
blank or {} |
<INSTANCE_CONFIG> |
{"resourcemanager_uri": "http://%%host%%:%%port%%", "cluster_name": "<CLUSTER_NAME>"} |
-
Collecting logs is disabled by default in the Datadog Agent, enable it in your
datadog.yamlfile:logs_enabled: true
-
Uncomment and edit the logs configuration block in your
yarn.d/conf.yamlfile. Change thetype,path, andserviceparameter values based on your environment. See the sample yarn.d/conf.yaml for all available configuration options.logs: - type: file path: <LOG_FILE_PATH> source: yarn service: <SERVICE_NAME> # To handle multi line that starts with yyyy-mm-dd use the following pattern # log_processing_rules: # - type: multi_line # pattern: \d{4}\-\d{2}\-\d{2} \d{2}:\d{2}:\d{2},\d{3} # name: new_log_start_with_date
To enable logs for Docker environments, see Docker Log Collection.
Run the Agent's status subcommand and look for yarn under the Checks section.
See metadata.csv for a list of metrics provided by this check.
The Yarn check does not include any events.
See service_checks.json for a list of service checks provided by this integration.
Need help? Contact Datadog support.