Capture RiakCS metrics in Datadog to:
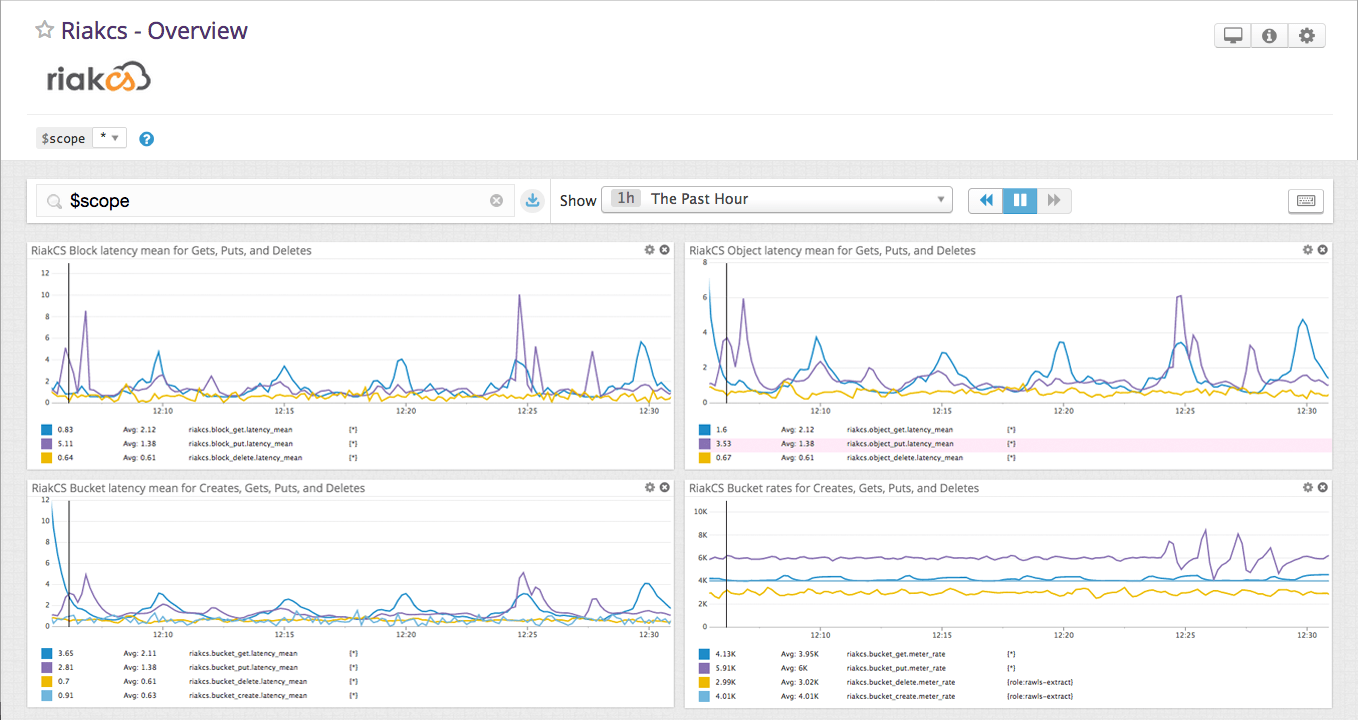
- Visualize key RiakCS metrics.
- Correlate RiakCS performance with the rest of your applications.
The RiakCS check is included in the Datadog Agent package, so you don't need to install anything else on your RiakCS nodes.
-
Edit the
riakcs.d/conf.yamlfile, in theconf.d/folder at the root of your Agent's configuration directory. See the sample riakcs.d/conf.yaml for all available configuration options:init_config: instances: ## @param access_id - string - required ## Enter you RiakCS access key. # - access_id: "<ACCESS_KEY>" ## @param access_secret - string - required ## Enter the corresponding RiakCS access secret. # access_secret: "<ACCESS_SECRET>"
Run the Agent's status subcommand and look for riakcs under the Checks section.
See metadata.csv for a list of metrics provided by this check.
For RiakCS v2.1+, the default metrics collected by this integrations includes most S3 API metrics as well as memory stats. Some have been excluded:
- bucketacl(get|put)
- objectacl(get|put)
- bucketpolicy(get|put|delete)
- in(one|total)
- time_error*
- _time_100
Any of the excluded metrics or additional metrics (1000+) can be added to the riakcs.d/conf.yaml configuration file with the metrics key in the instance_config. The value should be a list of metric names.
See the complete list of available metrics.
The RiakCS check does not include any events.
See service_checks.json for a list of service checks provided by this integration.
Need help? Contact Datadog support.
Additional helpful documentation, links, and articles: