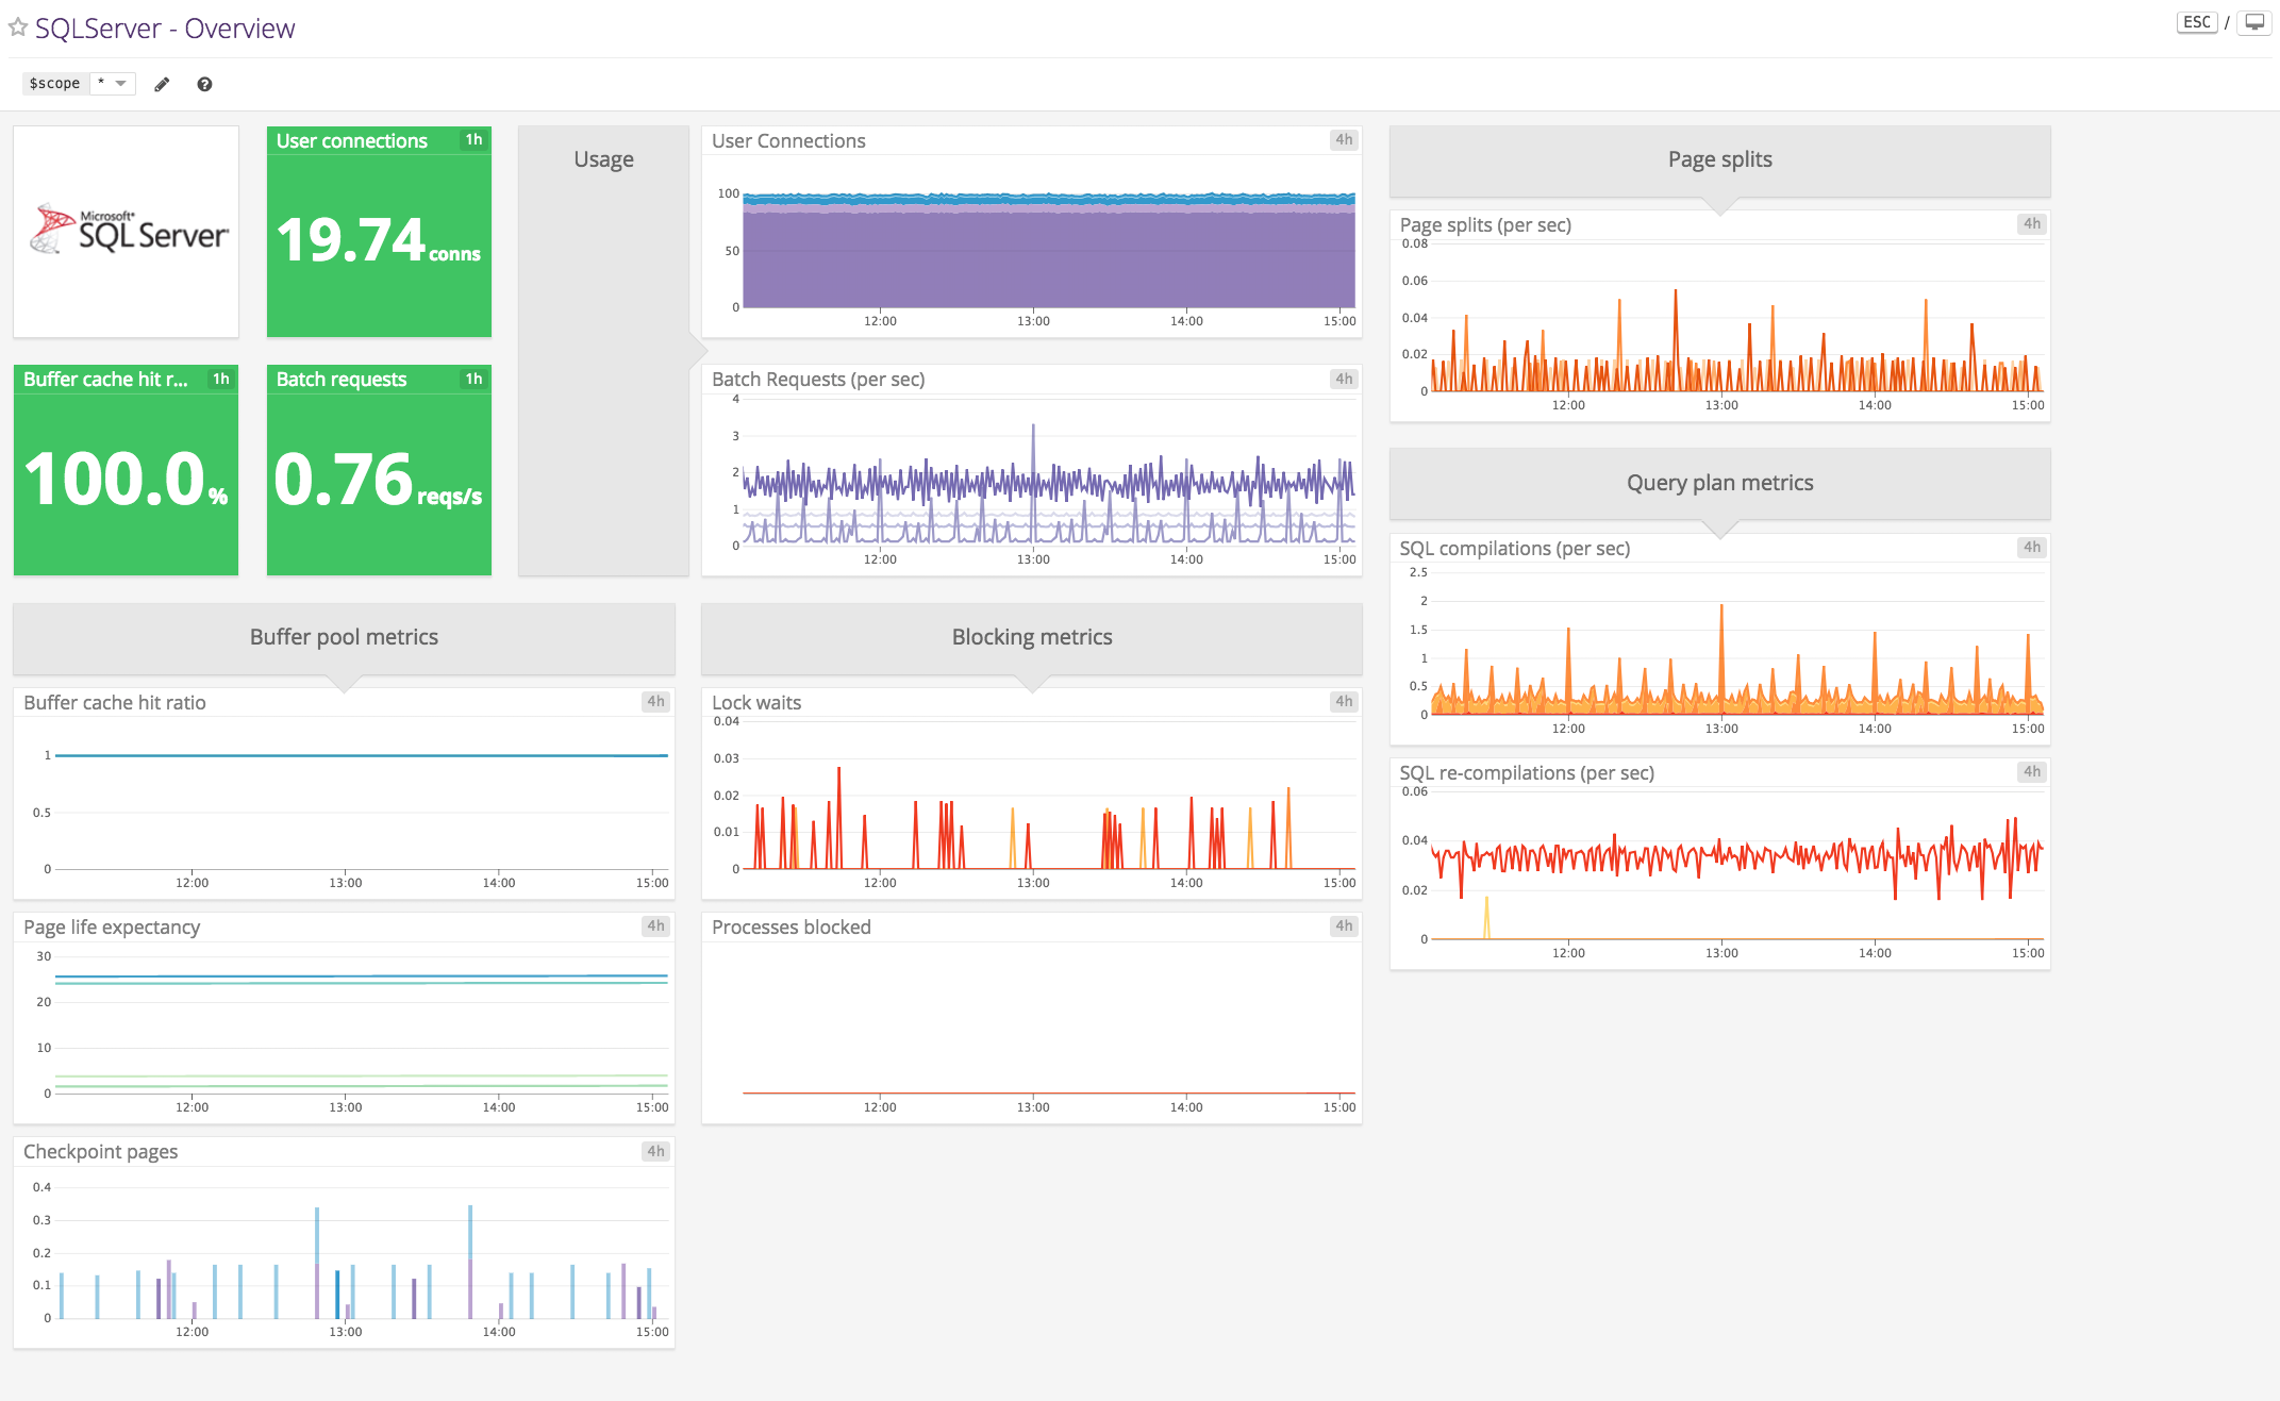
The SQL Server integration tracks the performance of your SQL Server instances. It collects metrics for number of user connections, rate of SQL compilations, and more.
Enable Database Monitoring (DBM) for enhanced insight into query performance and database health. In addition to the standard integration, Datadog DBM provides query-level metrics, live and historical query snapshots, wait event analysis, database load, query explain plans, and blocking query insights.
The SQL Server check is included in the Datadog Agent package. No additional installation is necessary on your SQL Server instances.
Make sure that your SQL Server instance supports SQL Server authentication by enabling "SQL Server and Windows Authentication mode" in the server properties:
Server Properties -> Security -> SQL Server and Windows Authentication mode
Note: To install Database Monitoring for SQL Server, select your hosting solution on the documentation site for instructions.
Proceed with the following steps in this guide only if you are installing the standard integration alone.
-
Create a read-only login to connect to your server:
    CREATE LOGIN datadog WITH PASSWORD = '<PASSWORD>';
    CREATE USER datadog FOR LOGIN datadog;
    GRANT SELECT on sys.dm_os_performance_counters to datadog;
    GRANT VIEW SERVER STATE to datadog;
To collect file size metrics per database, ensure the user you created (
datadog) has connect permission access to your databases by running:GRANT CONNECT ANY DATABASE to datadog; -
Make sure your SQL Server instance is listening on a specific fixed port. By default, named instances and SQL Server Express are configured for dynamic ports. See Microsoft's documentation for more details.
-
(Required for AlwaysOn and
sys.master_filesmetrics) To gather AlwaysOn andsys.master_filesmetrics, grant the following additional permission:GRANT VIEW ANY DEFINITION to datadog;
To configure this check for an Agent running on a host:
-
Edit the
sqlserver.d/conf.yamlfile, in theconf.d/folder at the root of your Agent's configuration directory. See the sample sqlserver.d/conf.yaml for all available configuration options:init_config: instances: - host: "<SQL_HOST>,<SQL_PORT>" username: datadog password: "<YOUR_PASSWORD>" connector: odbc # alternative is 'adodbapi' driver: SQL Server
See the example check configuration for a comprehensive description of all options, including how to use custom queries to create your own metrics.
Note: The (default) provider
SQLOLEDBis being deprecated. To use the newerMSOLEDBSQLprovider, set theadoprovidervariable toMSOLEDBSQLin yoursqlserver.d/conf.yamlfile after having downloaded the new provider from Microsoft. It is also possible to use the Windows Authentication and not specify the username/password with:connection_string: "Trusted_Connection=yes"
Extra configuration steps are required to get the SQL Server integration running on a Linux host:
- Install an ODBC SQL Server driver, for example the Microsoft ODBC driver or the FreeTDS driver.
- Copy the
odbc.iniandodbcinst.inifiles into the/opt/datadog-agent/embedded/etcfolder. - Configure the
conf.yamlfile to use theodbcconnector and specify the proper driver as indicated in theodbcinst.inifile.
Available for Agent versions >6.0
-
Collecting logs is disabled by default in the Datadog Agent, enable it in your
datadog.yamlfile:logs_enabled: true
-
Add this configuration block to your
sqlserver.d/conf.yamlfile to start collecting your SQL Server logs:logs: - type: file encoding: utf-16-le path: "<LOG_FILE_PATH>" source: sqlserver service: "<SERVICE_NAME>"
Change the
pathandserviceparameter values based on your environment. See the sample sqlserver.d/conf.yaml for all available configuration options.
For containerized environments, see the Autodiscovery Integration Templates for guidance on applying the parameters below.
| Parameter | Value |
|---|---|
<INTEGRATION_NAME> |
sqlserver |
<INIT_CONFIG> |
blank or {} |
<INSTANCE_CONFIG> |
{"host": "%%host%%,%%port%%", "username": "datadog", "password": "<UNIQUEPASSWORD>", "connector": "odbc", "driver": "FreeTDS"} |
See Autodiscovery template variables for details on passing <UNIQUEPASSWORD> as an environment variable instead of a label.
Available for Agent versions >6.0
Collecting logs is disabled by default in the Datadog Agent. To enable it, see Kubernetes Log Collection.
| Parameter | Value |
|---|---|
<LOG_CONFIG> |
{"source": "sqlserver", "service": "sqlserver"} |
Run the Agent's status subcommand and look for sqlserver under the Checks section.
See metadata.csv for a list of metrics provided by this check.
Most of these metrics come from your SQL Server's sys.dm_os_performance_counters table.
The SQL server check does not include any events.
See service_checks.json for a list of service checks provided by this integration.
Need help? Contact Datadog support.
