This integration connects to your TeamCity server to submit metrics, service checks, and events, allowing you to monitor the health of your TeamCity projects' build configurations, build runs, server resources, and more.
The TeamCity check is included in the Datadog Agent package, so you don't need to install anything else on your TeamCity servers.
-
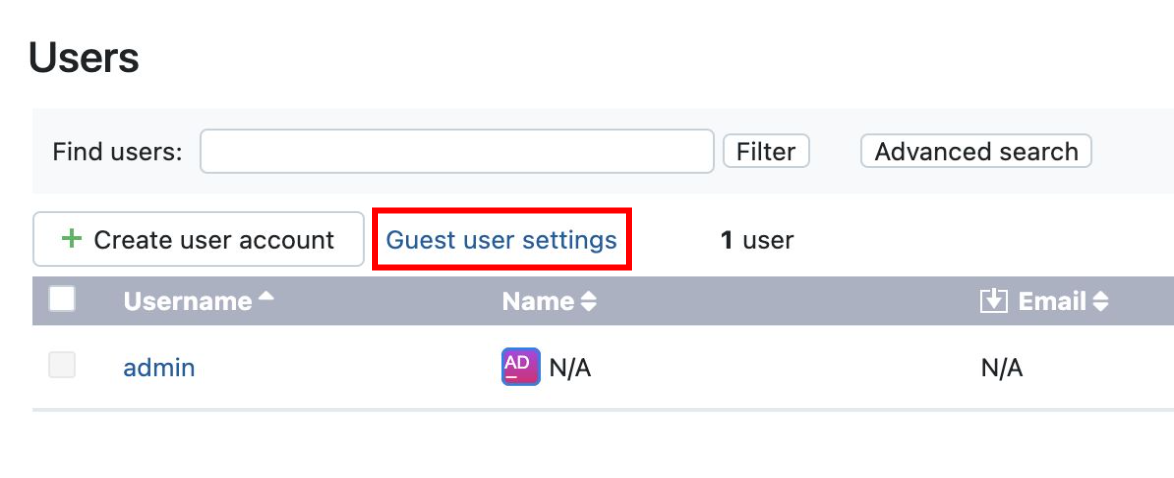
To prepare TeamCity, see Enabling Guest Login.
-
Enable
Per-project permissionsto allow assigning project-based permissions to the Guest user. See Changing Authorization Mode.
-
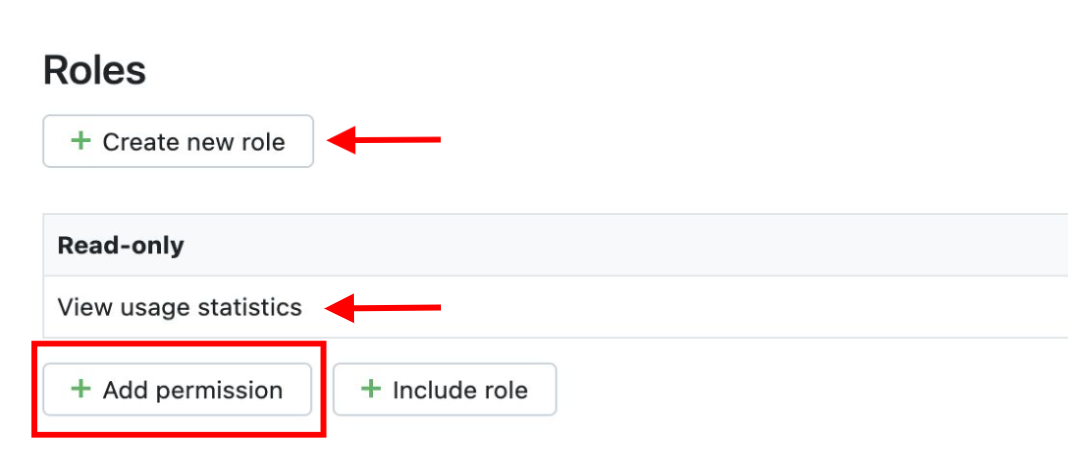
Use an existing or create a new Read-only role and add the
View Usage Statisticspermission to the role. See Managing Roles and Permissions.
-
[Optional] To enable the check to automatically detect build configuration type during event collection, add the
View Build Configuration Settingspermission to the Read-only role.
-
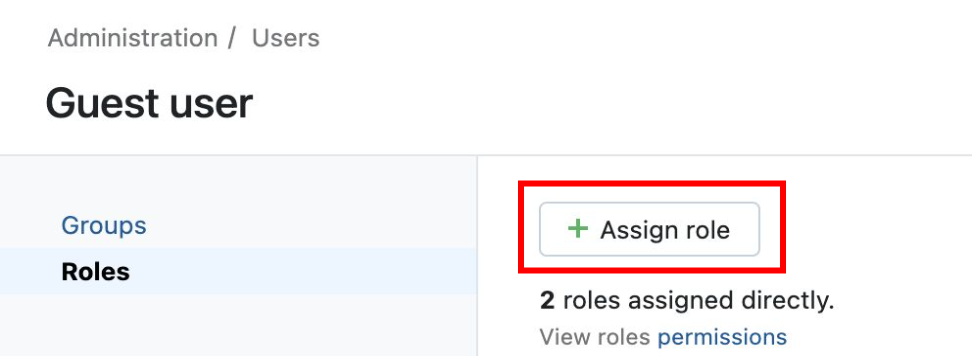
Assign the Read-only role to the Guest user. See Assigning Roles to Users.


To configure this check for an Agent running on a host:
Edit the teamcity.d/conf.yaml in the conf.d/ folder at the root of your Agent's configuration directory. See the sample teamcity.d/conf.yaml for all available configuration options:
The TeamCity check offers two methods of data collection. To optimally monitor your TeamCity environment, configure two separate instances to collect metrics from each method.
-
OpenMetricsV2 method (requires Python version 3):
Enable
use_openmetrics: trueto collect metrics from the TeamCity/metricsPrometheus endpoint.init_config: instances: ## @param server - string - required ## Specify the server name of your TeamCity instance. ## Enable Guest Authentication on your instance or enable the ## optional `basic_http_authentication` config param to collect data. ## If using `basic_http_authentication`, specify: ## ## server: http://<USER>:<PASSWORD>@teamcity.<ACCOUNT_NAME>.com # - server: http://teamcity.<ACCOUNT_NAME>.com ## @param use_openmetrics - boolean - optional - default: false ## Use the latest OpenMetrics V2 implementation to collect metrics from ## the TeamCity server's Prometheus metrics endpoint. ## Requires Python version 3. ## ## Enable in a separate instance to collect Prometheus metrics. ## This option does not collect events, service checks, or metrics from the TeamCity REST API. # use_openmetrics: true
Note: To collect OpenMetrics-compliant histogram and summary metrics (available starting in TeamCity Server 2022.10+), add the internal property, teamcity.metrics.followOpenMetricsSpec=true. See, TeamCity Internal Properties.
-
TeamCity Server REST API method:
Configure a separate instance in the
teamcity.d/conf.yamlfile to collect additional build-specific metrics, service checks, and build status events from the TeamCity server's REST API. Specify your projects and build configurations using theprojectsoption (requires Python version 3):init_config: instances: - server: http://teamcity.<ACCOUNT_NAME>.com ## @param projects - mapping - optional ## Mapping of TeamCity projects and build configurations to ## collect events and metrics from the TeamCity REST API. # projects: <PROJECT_A>: include: - <BUILD_CONFIG_A> - <BUILD_CONFIG_B> exclude: - <BUILD_CONFIG_C> <PROJECT_B>: include: - <BUILD_CONFIG_D> <PROJECT_C>: {}
Customize each project's build configuration monitoring using the optional
includeandexcludefilters to specify build configuration IDs to include or exclude from monitoring, respectively. RegEx patterns are supported in theincludeandexcludekeys to specify build configuration ID matching patterns. If bothincludeandexcludefilters are omitted, all build configurations are monitored for the specified project.For Python version 2, configure one build configuration ID per instance using the
build_configurationoption:init_config: instances: - server: http://teamcity.<ACCOUNT_NAME>.com ## @param projects - mapping - optional ## Mapping of TeamCity projects and build configurations to ## collect events and metrics from the TeamCity REST API. # build_configuration: <BUILD_CONFIGURATION_ID>
Restart the Agent to start collecting and sending TeamCity events to Datadog.
-
Configure TeamCity logging settings.
-
By default, Datadog's integration pipeline supports the following kind of log format:
[2020-09-10 21:21:37,486] INFO - jetbrains.buildServer.STARTUP - Current stage: System is readyClone and edit the integration pipeline if you defined different conversion patterns.
-
Collecting logs is disabled by default in the Datadog Agent. Enable it in your
datadog.yamlfile:logs_enabled: true
-
Uncomment the following configuration block in your
teamcity.d/conf.yamlfile. Change thepathparameter value based on your environment. See the sample teamcity.d/conf.yaml for all available configuration options.logs: - type: file path: /opt/teamcity/logs/teamcity-server.log source: teamcity - type: file path: /opt/teamcity/logs/teamcity-activities.log source: teamcity - type: file path: /opt/teamcity/logs/teamcity-vcs.log source: teamcity - type: file path: /opt/teamcity/logs/teamcity-cleanup.log source: teamcity - type: file path: /opt/teamcity/logs/teamcity-notifications.log source: teamcity - type: file path: /opt/teamcity/logs/teamcity-ws.log source: teamcity
For containerized environments, see the Autodiscovery Integration Templates for guidance on applying the parameters below.
| Parameter | Value |
|---|---|
<INTEGRATION_NAME> |
teamcity |
<INIT_CONFIG> |
blank or {} |
<INSTANCE_CONFIG> |
{"server": "%%host%%", "use_openmetrics": "true"} |
Collecting logs is disabled by default in the Datadog Agent. To enable it, see Kubernetes log collection.
| Parameter | Value |
|---|---|
<LOG_CONFIG> |
{"source": "teamcity"} |
Run the Agent's status subcommand and look for teamcity under the Checks section.
See metadata.csv for a list of metrics provided by this check.
TeamCity events representing successful and failed builds are forwarded to Datadog.
See service_checks.json for a list of service checks provided by this integration.
Need help? Contact Datadog support.