intermittent failures in pod exec operations in jenkins-x pipelines #2582
Comments
|
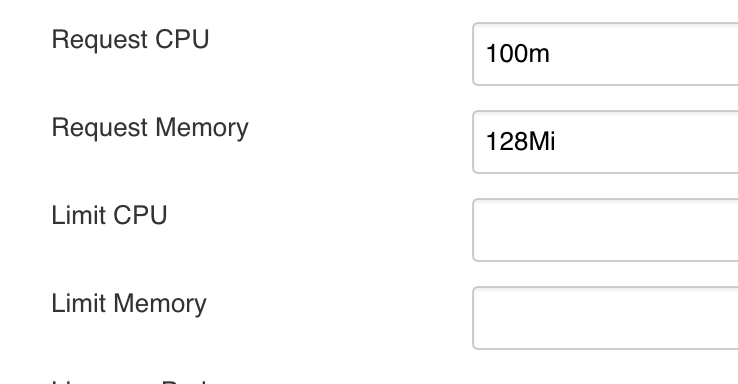
It seems to always work on a re-trigger, presumably because then only one pipeline is running. It seems to especially affect the examples cluster, which does run the most parallel pipelines. So I had a look at the build pod resources and noted they are now up to:
Whereas the defaults are:
|

|
A new instance of this is http://jenkins.jx.35.242.205.159.nip.io/job/Activiti/job/activiti-cloud-notifications-service-graphql/job/develop/23/console Note that is on the cloud cluster, not examples |
|
I also had a look at the cloud cluster and am seeing that during the peak there can be about 7 maven build pods running and each uses about 500mCPU and 600Mi. This currently leaves the cluster able to meet the requests but the pods are actually exceeding the requests and the cluster is not able to meet the limit numbers. Usage did not appear to hit the limits of availability during the time I was watching but I did notice that the notifications service tests seem to be especially intensive. That pod can use 1237mCPU and 1019Mi, so it can briefly go above the limits which are currently set at 1 and 1024Mi. The cluster has the ability to add an extra node as part of the autoscaling group but I think that would require to be hitting its limits for a sustained period. We're talking about short-lived jobs and if one of them fails then that's actually quite an inconvenience for us. In the process I did notice jenkins-x/jx#3267 I have put the requests back up to around 700mCPU and 900Mi as that is more representative of usage and added an extra node. This may help - we can continue to keep an eye on it. |
|
I don't think this is exclusively about resource availability but it looks like an aggravating factor. |
|
Just seen another whole set of these failures at about the same time: http://jenkins.jx.35.228.195.195.nip.io/job/Activiti/job/activiti-cloud-query/job/PR-164/1/console So all coming from one build of activiti-cloud-dependencies:
So that run we didn't see the problem on the cloud cluster. But instead we did see it on the examples cluster. |

|
Now changed the examples cluster maven builder pod resources to match the cloud one:
Then manually started build creating version 7.1.19 of acitiviti-cloud-dependencies Then I watched this and realised that most of the resource usage is the dind pods:
Note the numbers are considerably higher than https://github.com/Activiti/activiti-cloud-audit/blob/7af19da9ade79af70d2292e30adf689ca6b28c8a/maven-dind.yaml#L38 Not sure whether this is related as the failures I see in the pipeline as they all fail at the point when the maven build has just succeeded (in each case the Perhaps that needs a Another way to tackle this might be to try to limit the total number of concurrent jobs on the cluster but I think that's a bit special with the jenkins kubernetes plugin. This problem does not affect the ttc cluster and that has about the same number of concurrent jobs and also uses dind. One difference is that the ttc jobs only do maven builds on PR, not the additional make steps. So we could try doing the same as ttc as skip the helm build for PRs |


|
I did a I checked with Seems like we could reduce the requests on both a bit and try setting each to the same value. |
|
Made the change to reduce requests on example runtime bundle and it built ok - http://jenkins.jx.35.228.195.195.nip.io/job/Activiti/job/example-runtime-bundle/job/master/160/console so merged for the others too. Then did another manual build of activiti-cloud-dependencies to produce version 7.1.20 - that seems to go through fine from a jenkins perspective. (Some jobs got queued on travis, presumably because I've now run it so much that we're hitting travis quotas.) Looks promising this time. |
|
Examples cluster is looking better so far. Saw an interesting example of this in the cloud cluster. Error is This happens during updatebot commands and actually gets retried https://github.com/Activiti/activiti-cloud-service-common/blob/develop/Jenkinsfile#L60 So presumably what is happening here is that any steps wrapped in |
|
With the resource changes above this seems to be much less common now - just had a couple of fully clean runs I don't expect it will be fully gone but it is at least less common. |
takes a little while to generate updatebot PRs so spreading out the examples-level ones might further help their reliability Activiti/Activiti#2582
match to example-runtime-bundle following Activiti/Activiti#2582 (comment)
match to example-runtime-bundle following Activiti/Activiti#2582 (comment)
match to example-runtime-bundle following Activiti/Activiti#2582 (comment)
match to example-runtime-bundle following Activiti/Activiti#2582 (comment)
Have raised
jenkins-x/jx#2861
This seems especially likely to happen when multiple builds happen in parallel. Earlier I saw:
They were all failures with the same error message:
java.util.concurrent.RejectedExecutionException: Task okhttp3.RealCall$AsyncCall@5a85ec0b rejected from java.util.concurrent.ThreadPoolExecutor@2e54f447[Terminated, pool size = 0, active threads = 0, queued tasks = 0, completed tasks = 20]
at java.util.concurrent.ThreadPoolExecutor$AbortPolicy.rejectedExecution(ThreadPoolExecutor.java:2063)
at java.util.concurrent.ThreadPoolExecutor.reject(ThreadPoolExecutor.java:830)
at java.util.concurrent.ThreadPoolExecutor.execute(ThreadPoolExecutor.java:1379)
at okhttp3.Dispatcher.enqueue(Dispatcher.java:130)
at okhttp3.RealCall.enqueue(RealCall.java:100)
at okhttp3.internal.ws.RealWebSocket.connect(RealWebSocket.java:183)
at okhttp3.OkHttpClient.newWebSocket(OkHttpClient.java:436)
at io.fabric8.kubernetes.client.dsl.internal.PodOperationsImpl.exec(PodOperationsImpl.java:267)
at io.fabric8.kubernetes.client.dsl.internal.PodOperationsImpl.exec(PodOperationsImpl.java:61)
at org.csanchez.jenkins.plugins.kubernetes.pipeline.ContainerExecDecorator$1.doLaunch(ContainerExecDecorator.java:318)
at org.csanchez.jenkins.plugins.kubernetes.pipeline.ContainerExecDecorator$1.launch(ContainerExecDecorator.java:236)
at hudson.Launcher$ProcStarter.start(Launcher.java:455)
at org.jenkinsci.plugins.durabletask.BourneShellScript.launchWithCookie(BourneShellScript.java:188)
http://jenkins.jx.35.228.195.195.nip.io/job/Activiti/job/activiti-cloud-query/job/PR-154/1/console
http://jenkins.jx.35.228.195.195.nip.io/job/Activiti/job/activiti-cloud-audit/job/PR-154/1/console
http://jenkins.jx.35.228.195.195.nip.io/job/Activiti/job/activiti-cloud-notifications-graphql/job/PR-42/1/console
In each case the travis builds all passed without problems.
It could be related to resource usage in the cluster. Will have to try to get there quick enough to see resource usage at the time when it happens.
The text was updated successfully, but these errors were encountered: