Fix "Your system has run out of application memory" bug #1341
Comments
|
As discussed on Facebook @randomeizer - I THINK this might have something to do with |
|
I'm going to close this issue for now as it's too broad. |
|
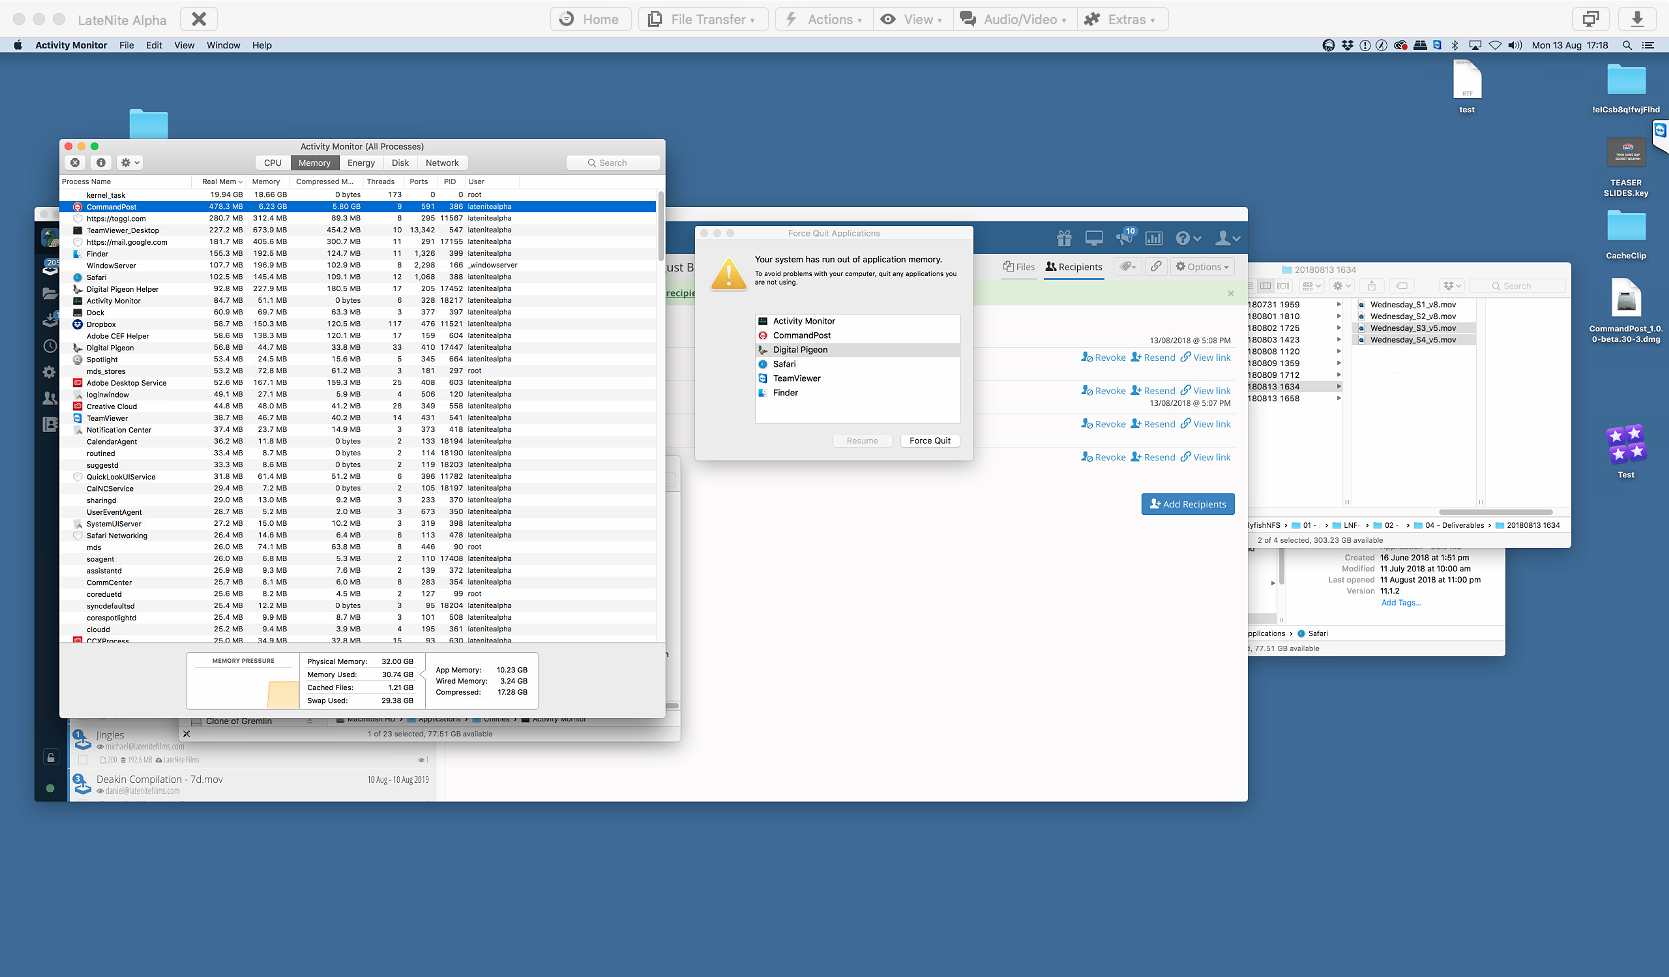
Kevin reports: Before:
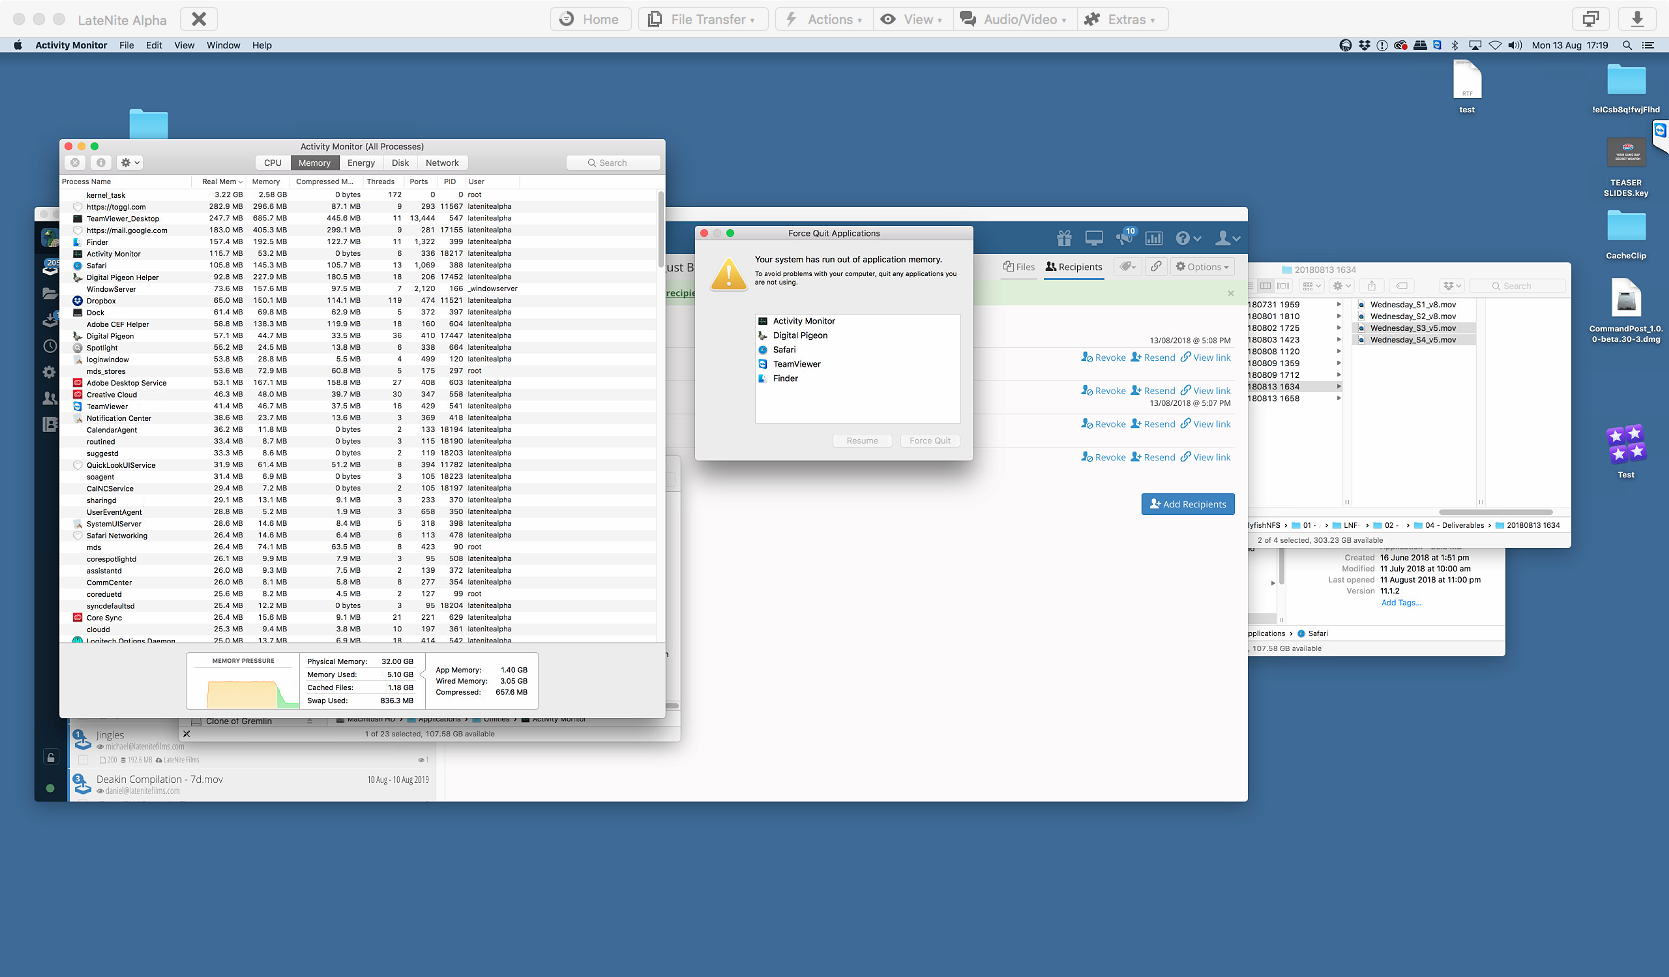
After Force Quitting:
|
|
The highlighted values are constantly increasing, even with Final Cut Pro closed:
|

|
This is what happens when I click the little arrow icon next to the
|
|
Before opening Final Cut Pro:
After opening and using Final Cut Pro:
|
|
|


|
What are you gleaning from this? |
|
|


|
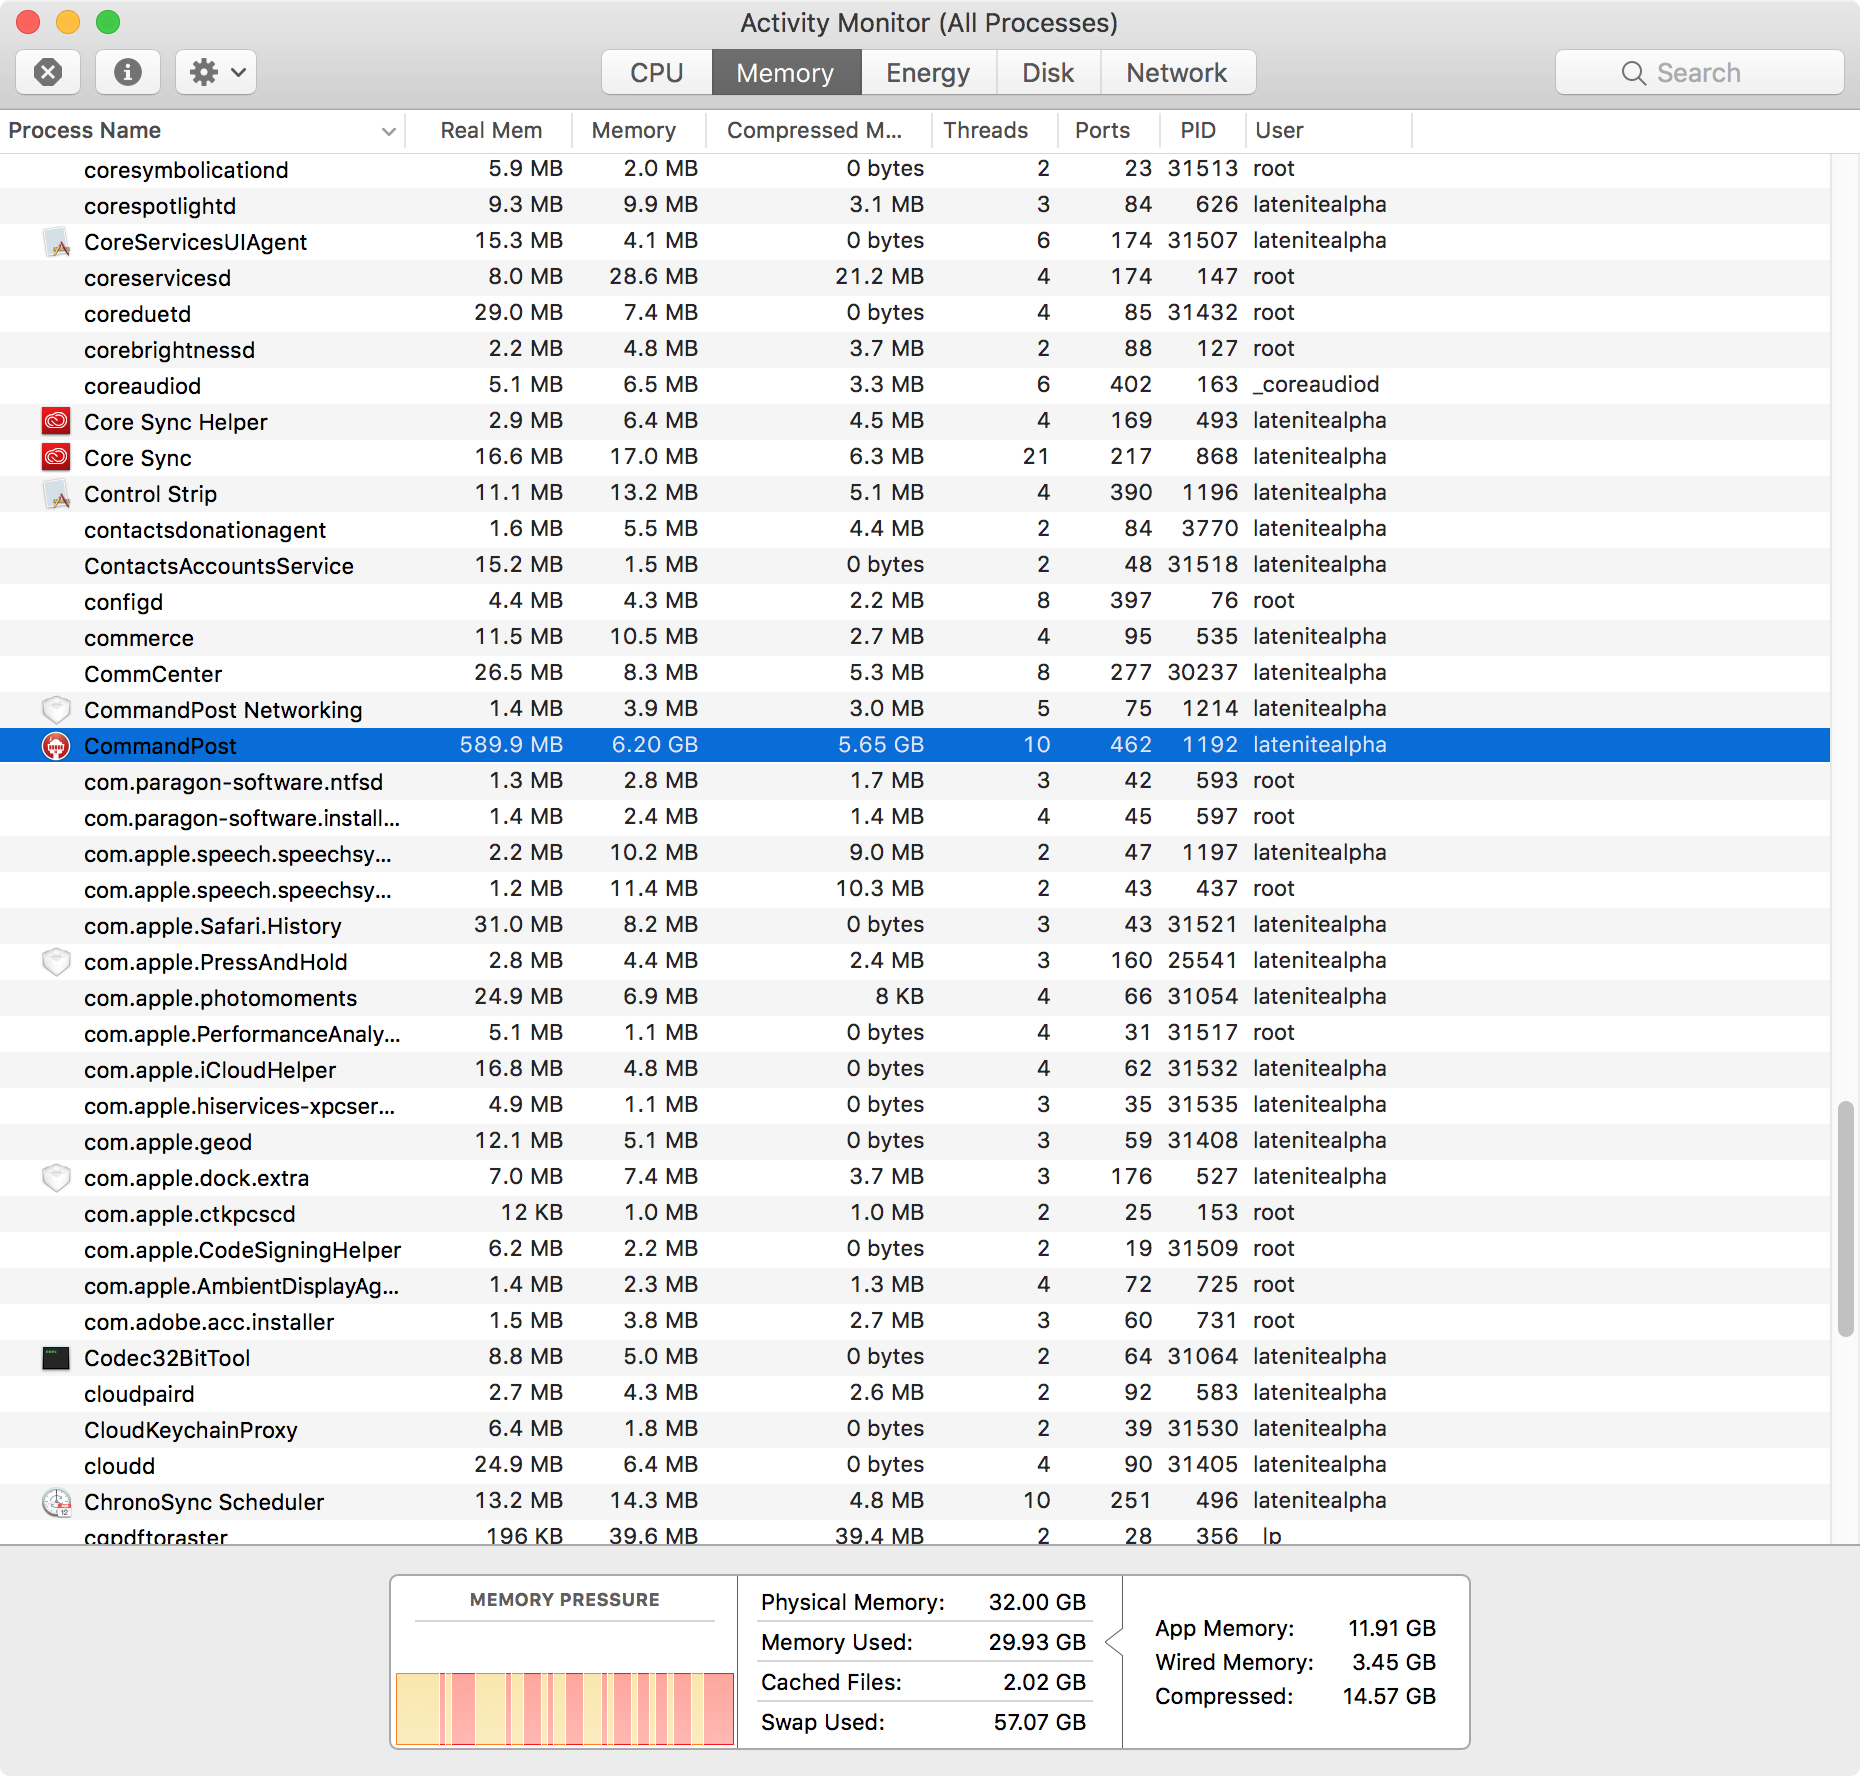
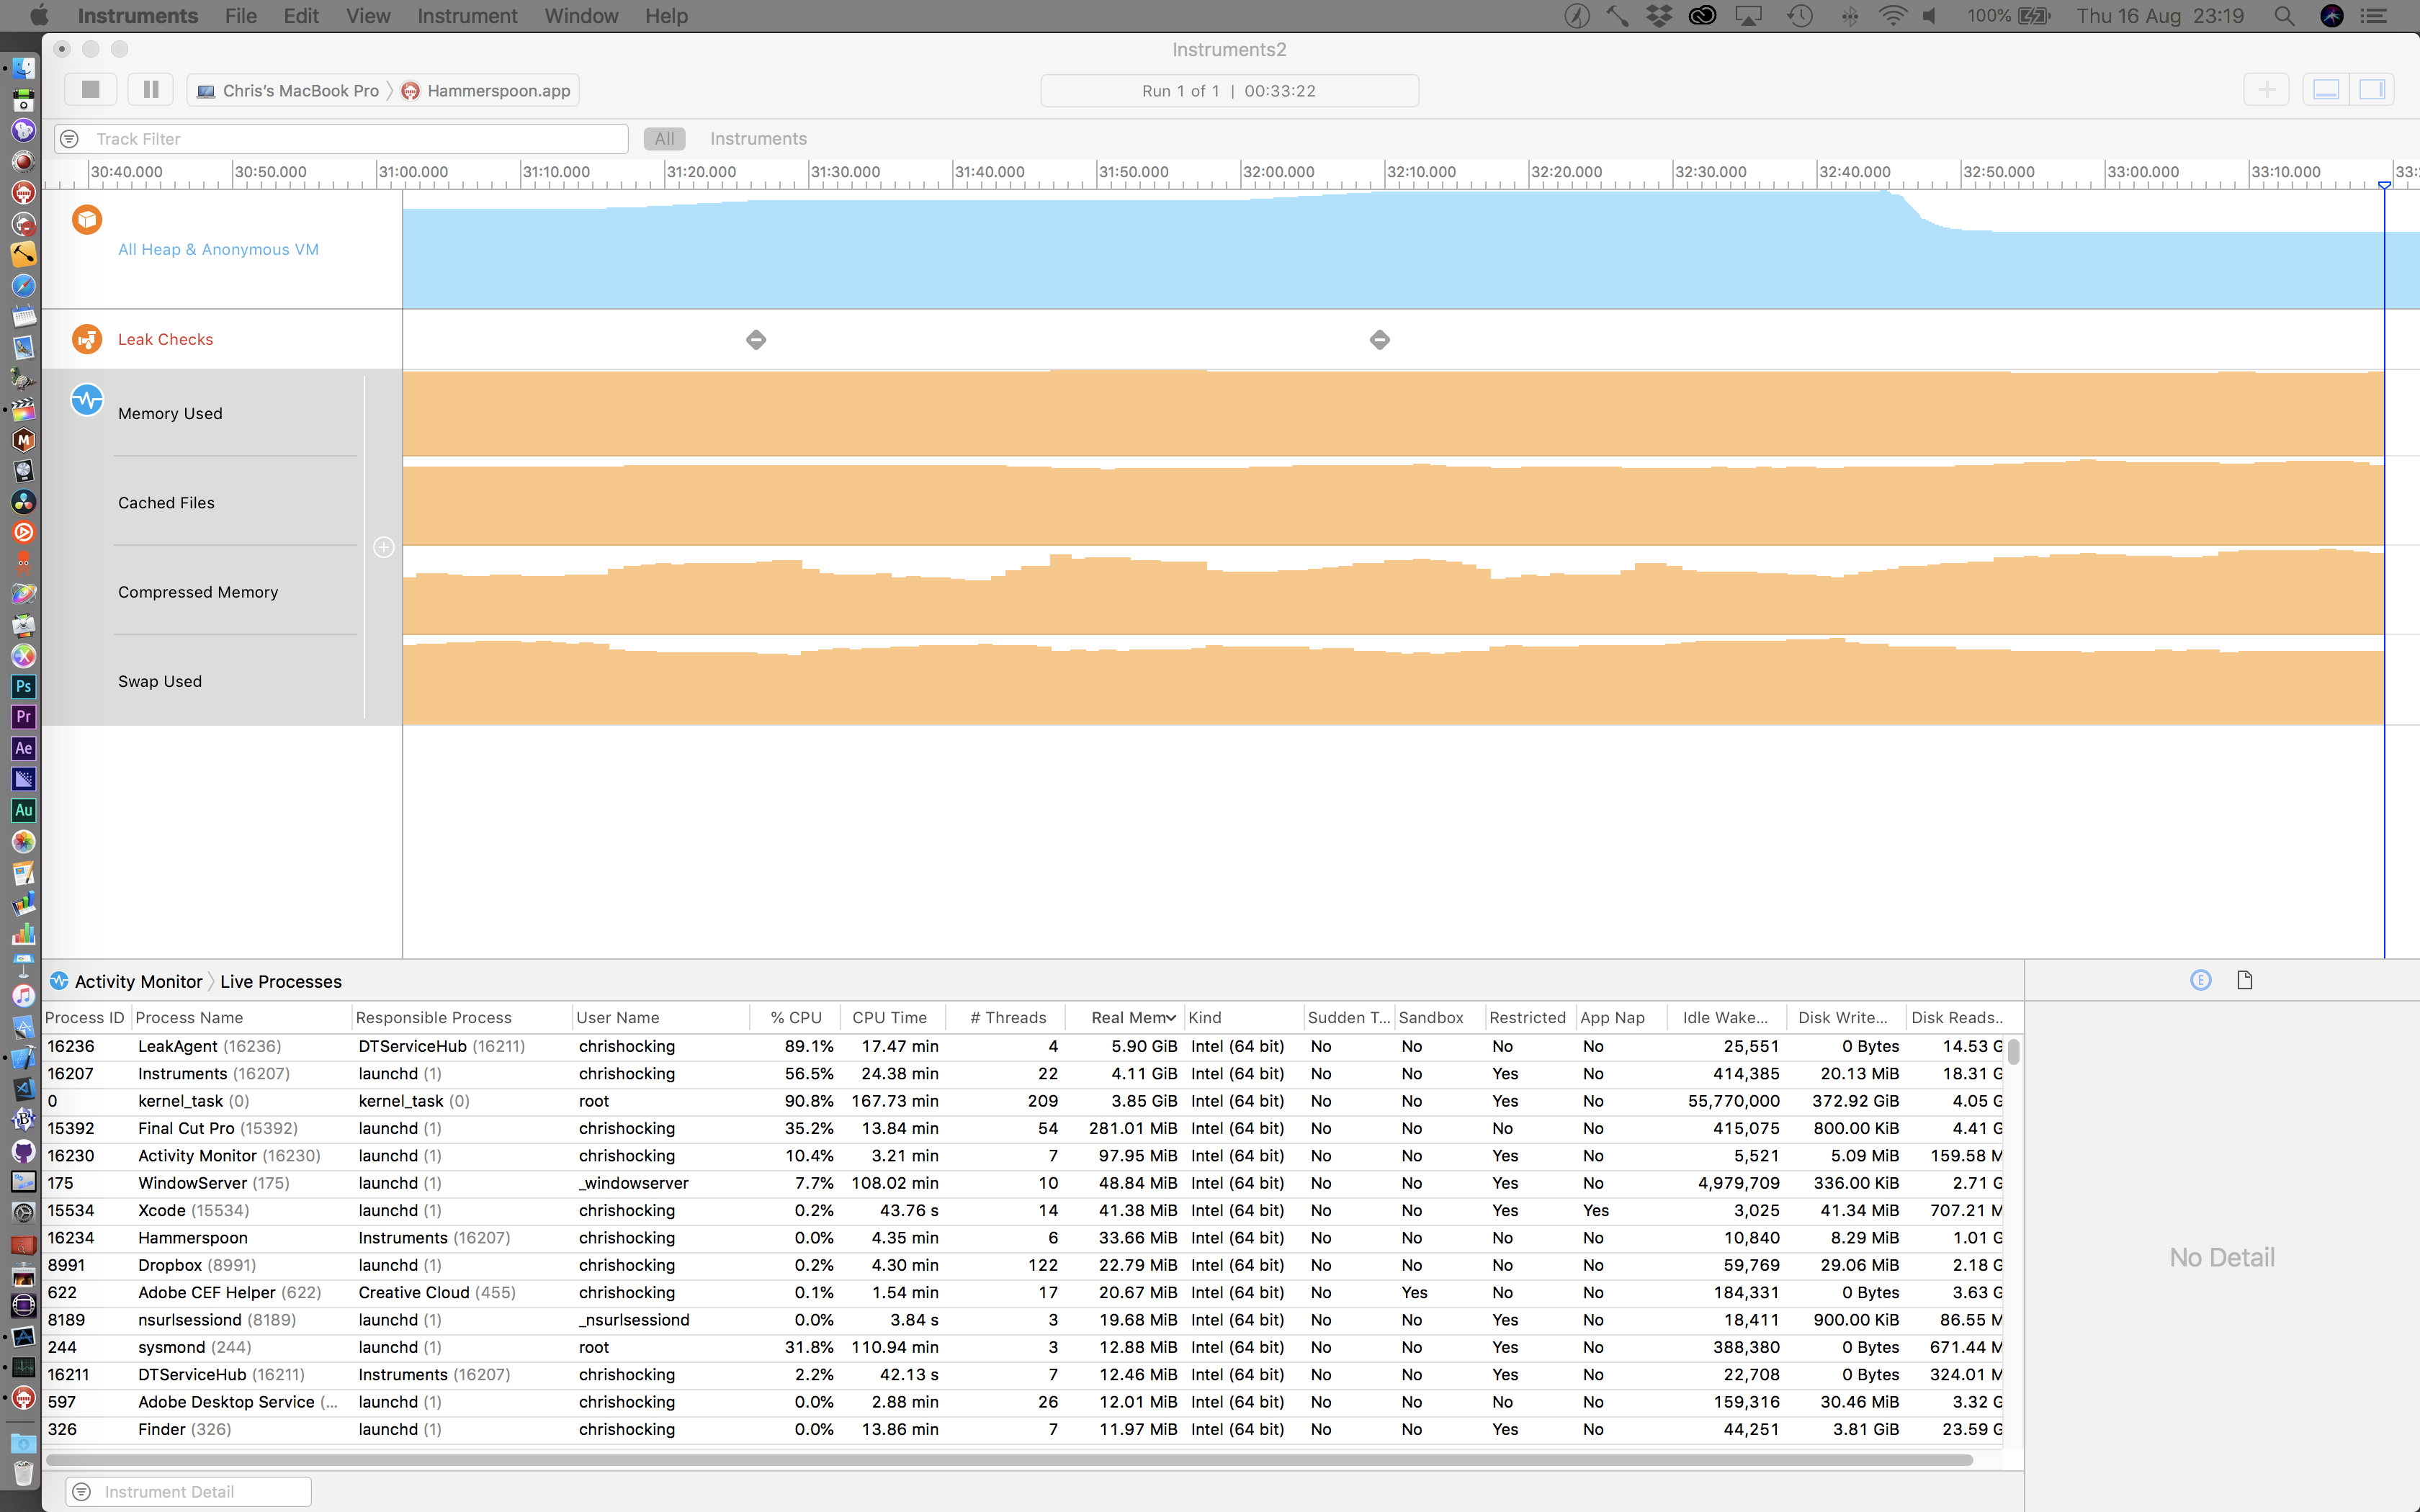
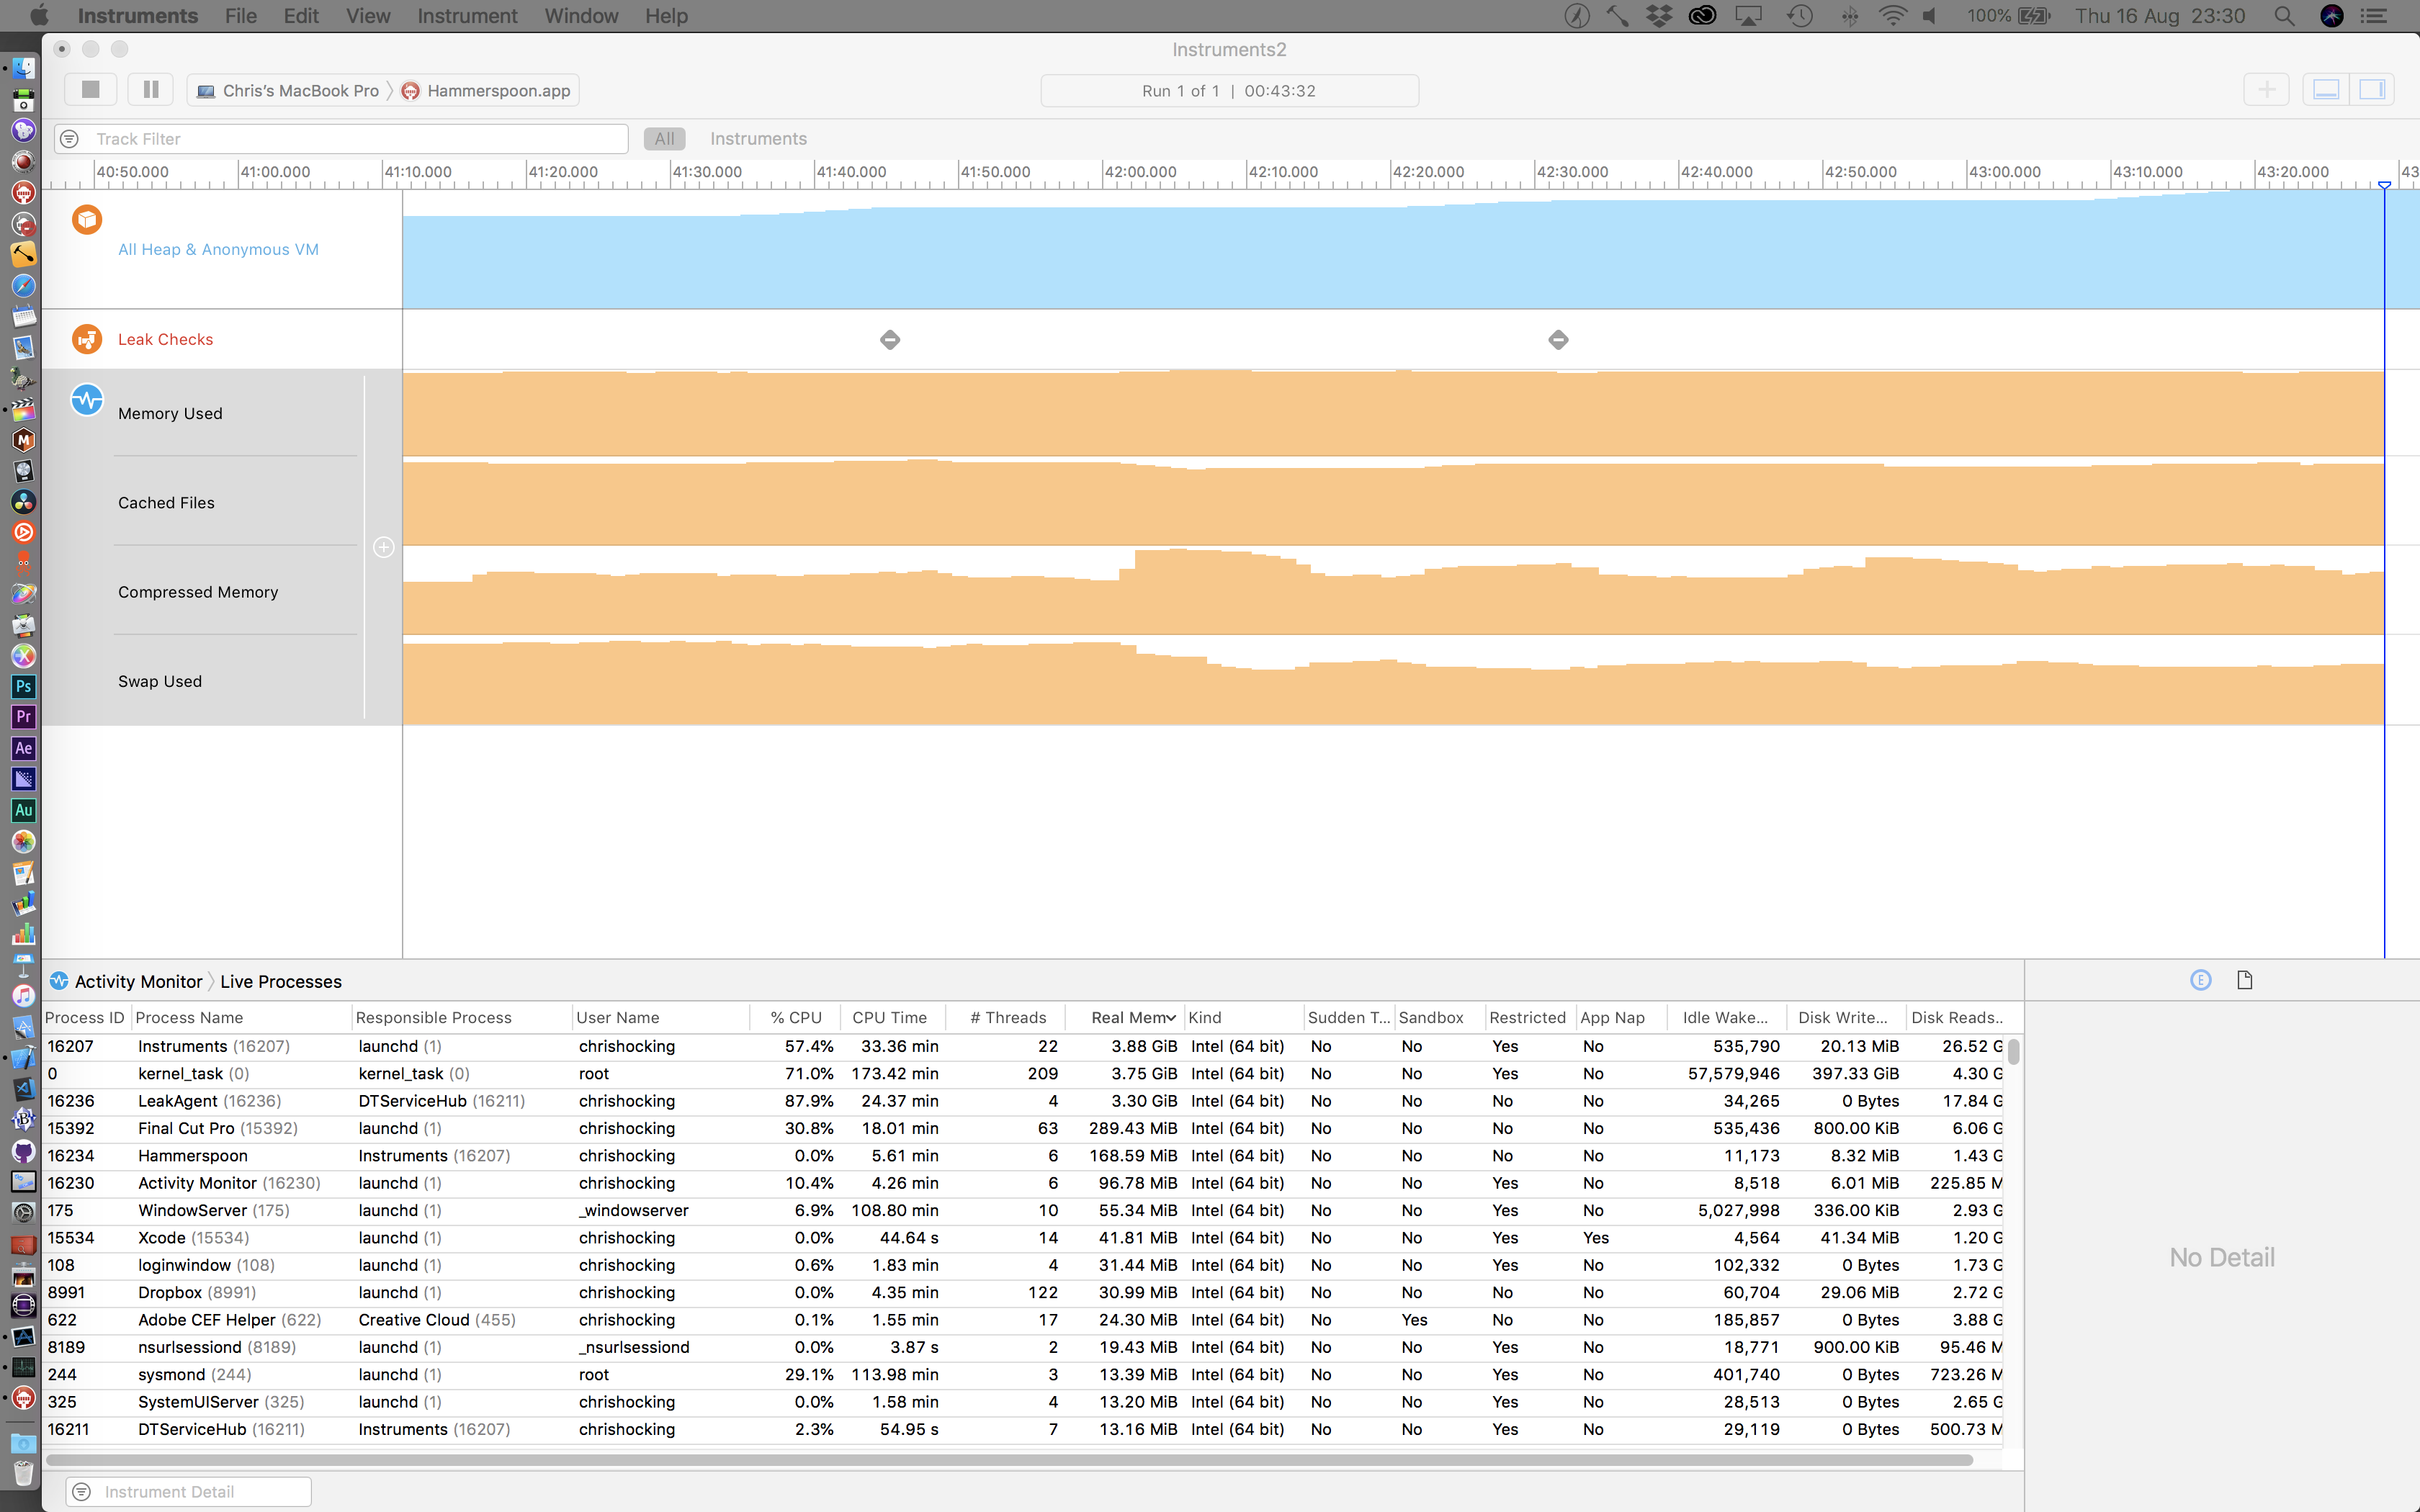
I left my computer running overnight with CommandPost running via the Leaks Instrument in Xcode, and Final Cut Pro playing a timeline on loop whilst also running the following code: chaosTimer = hs.timer.doEvery(30, function()
_fcp:inspector():show()
hs.timer.doAfter(5, function()
_fcp:inspector():hide()
end)
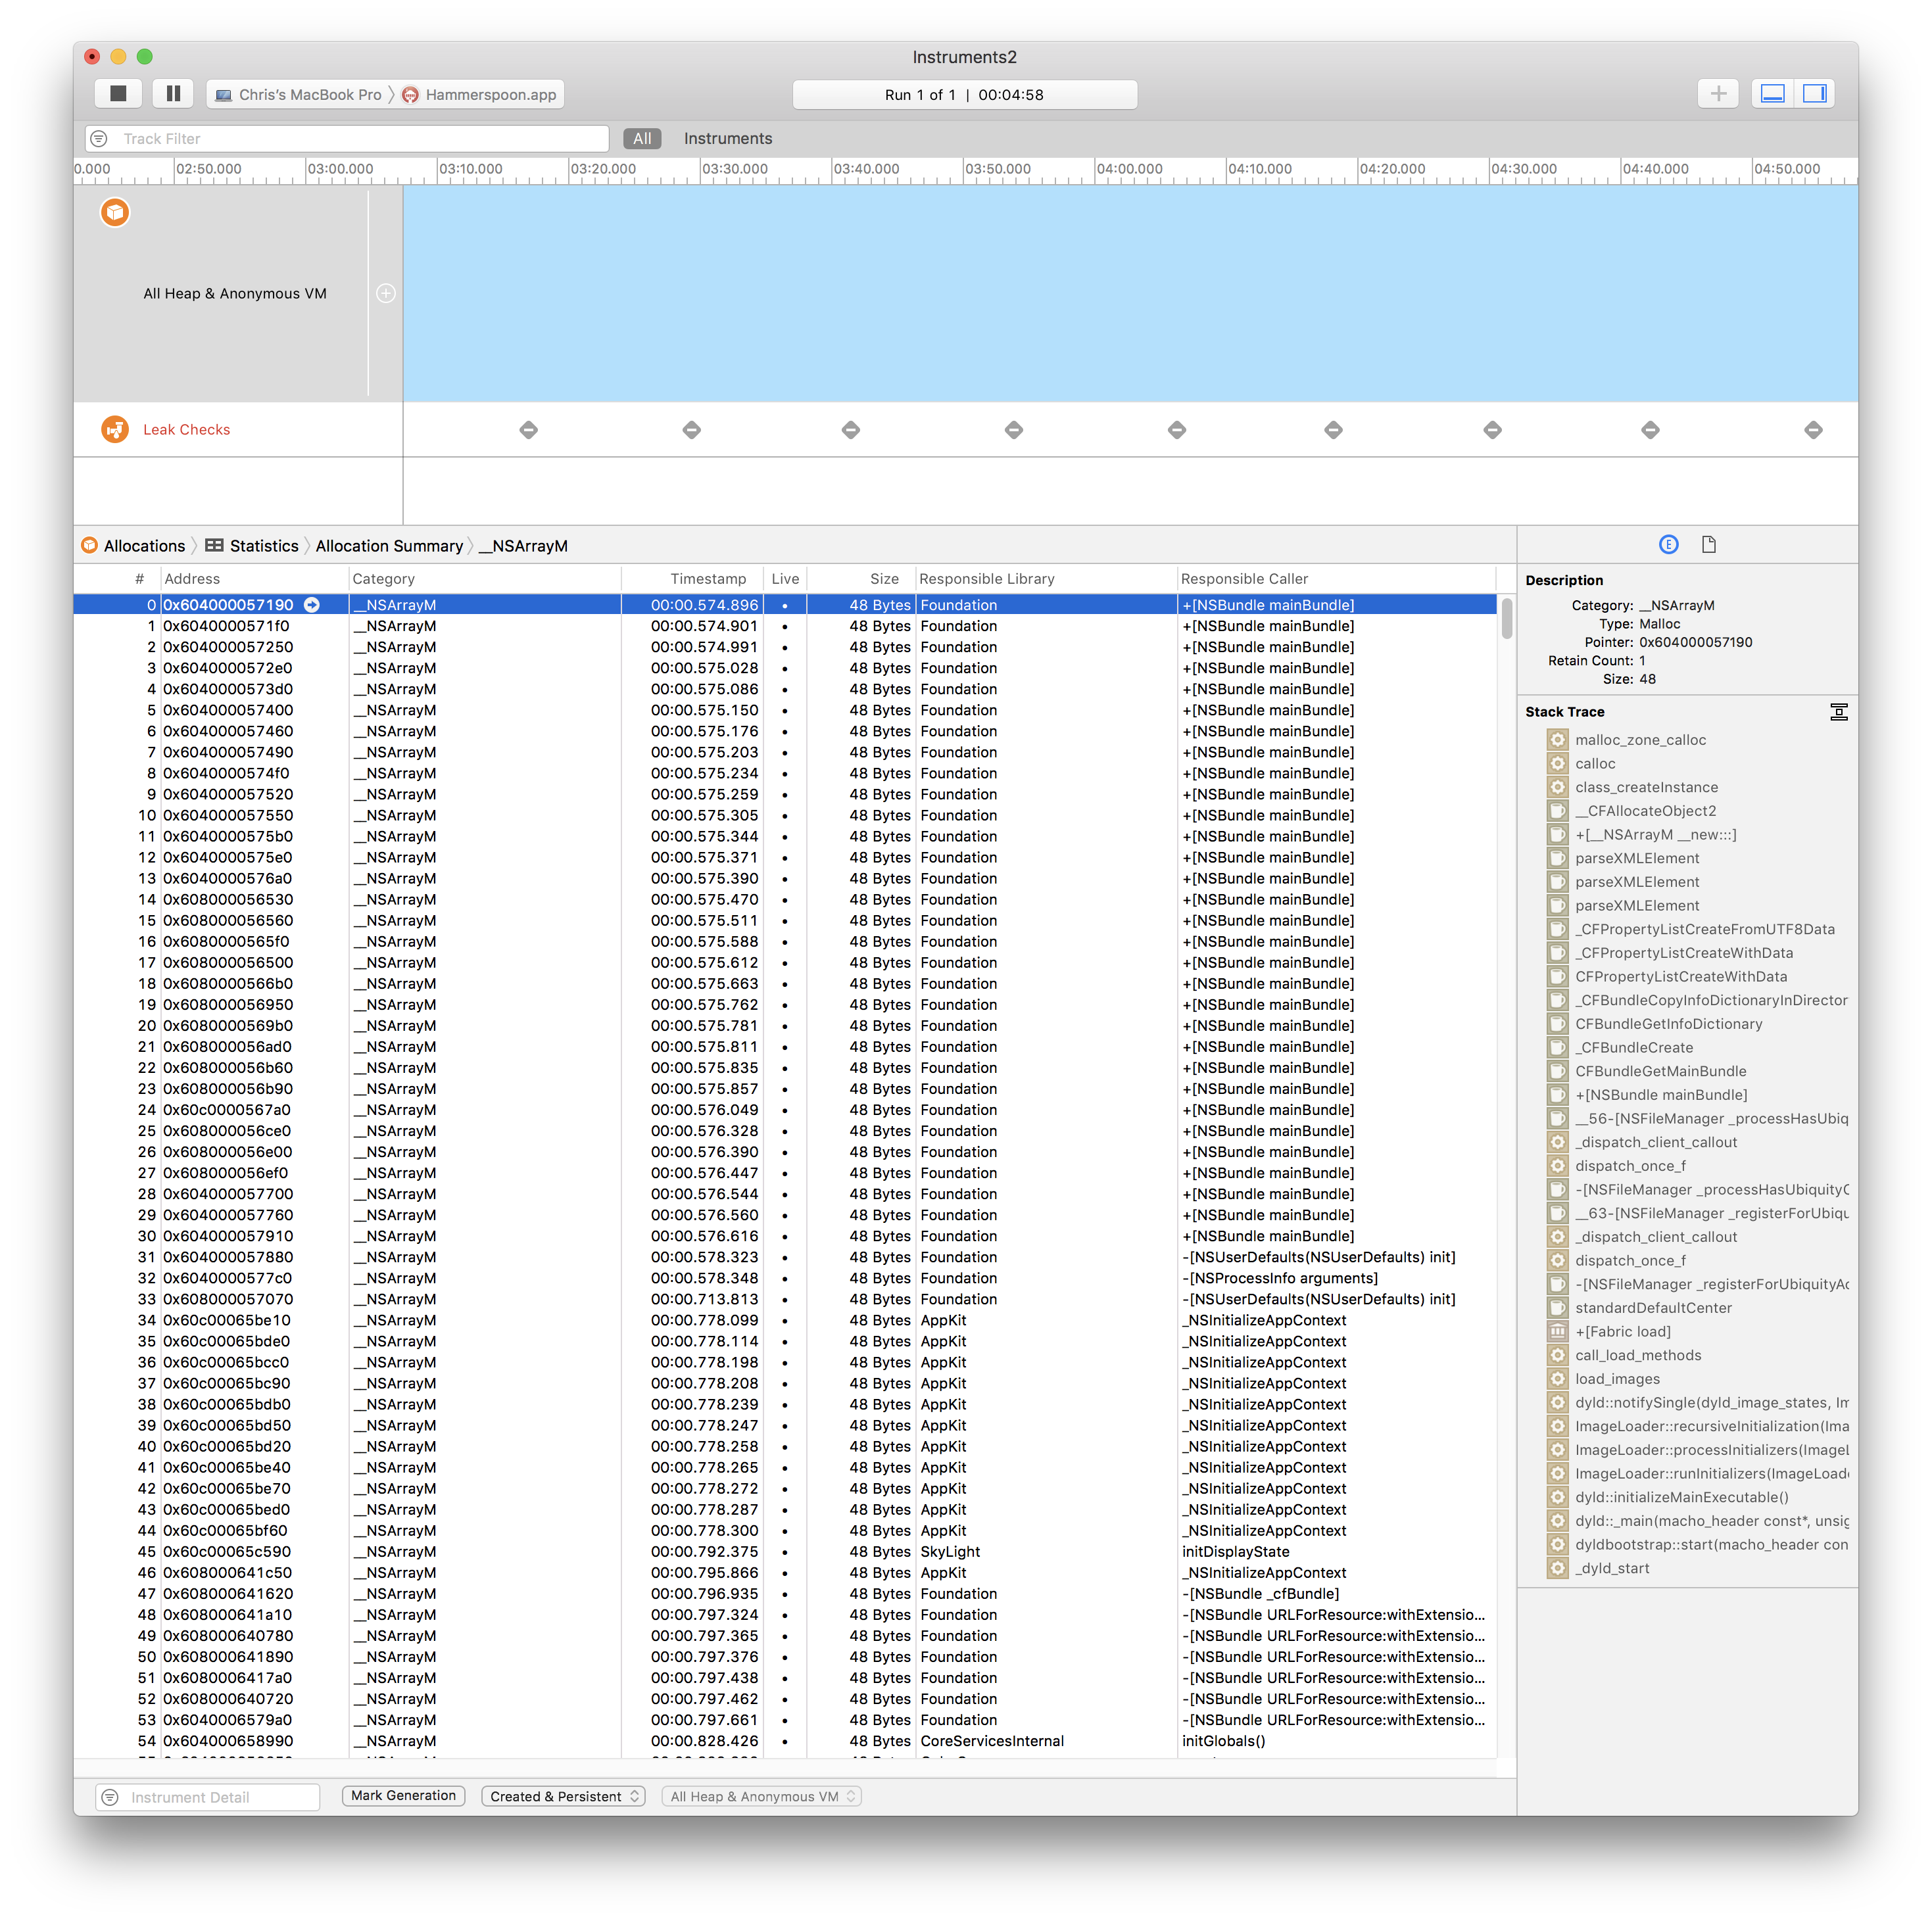
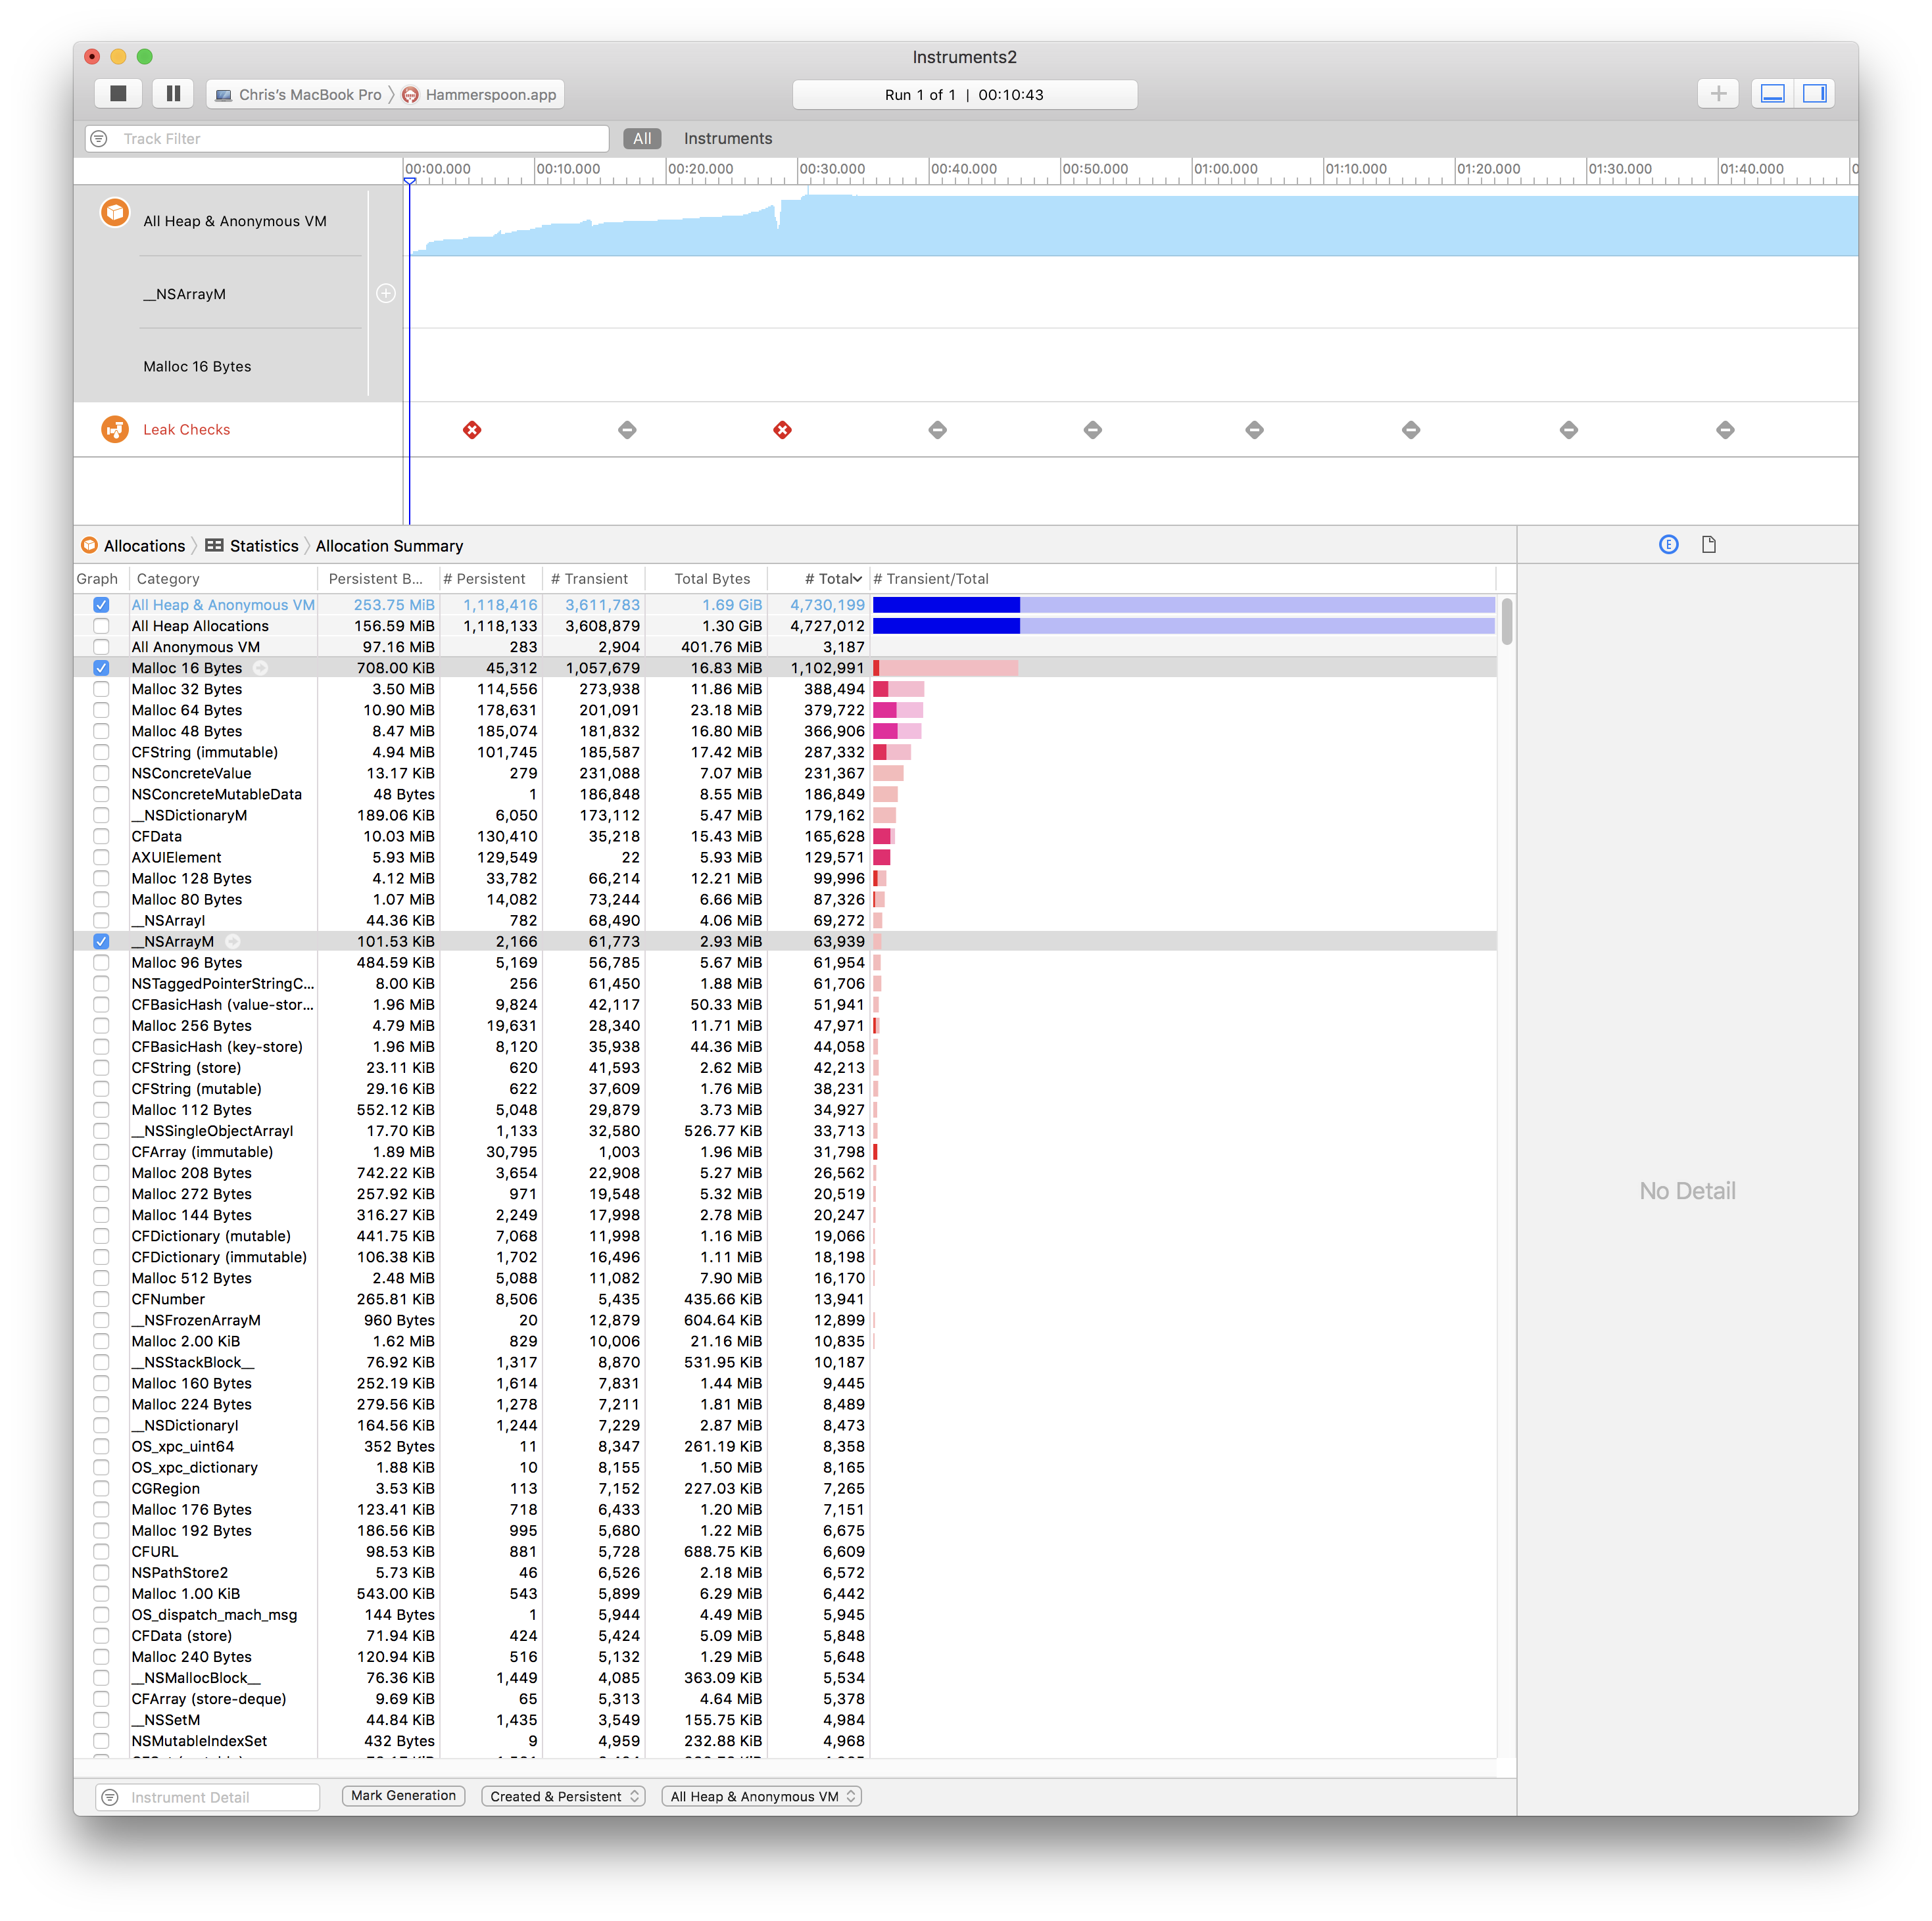
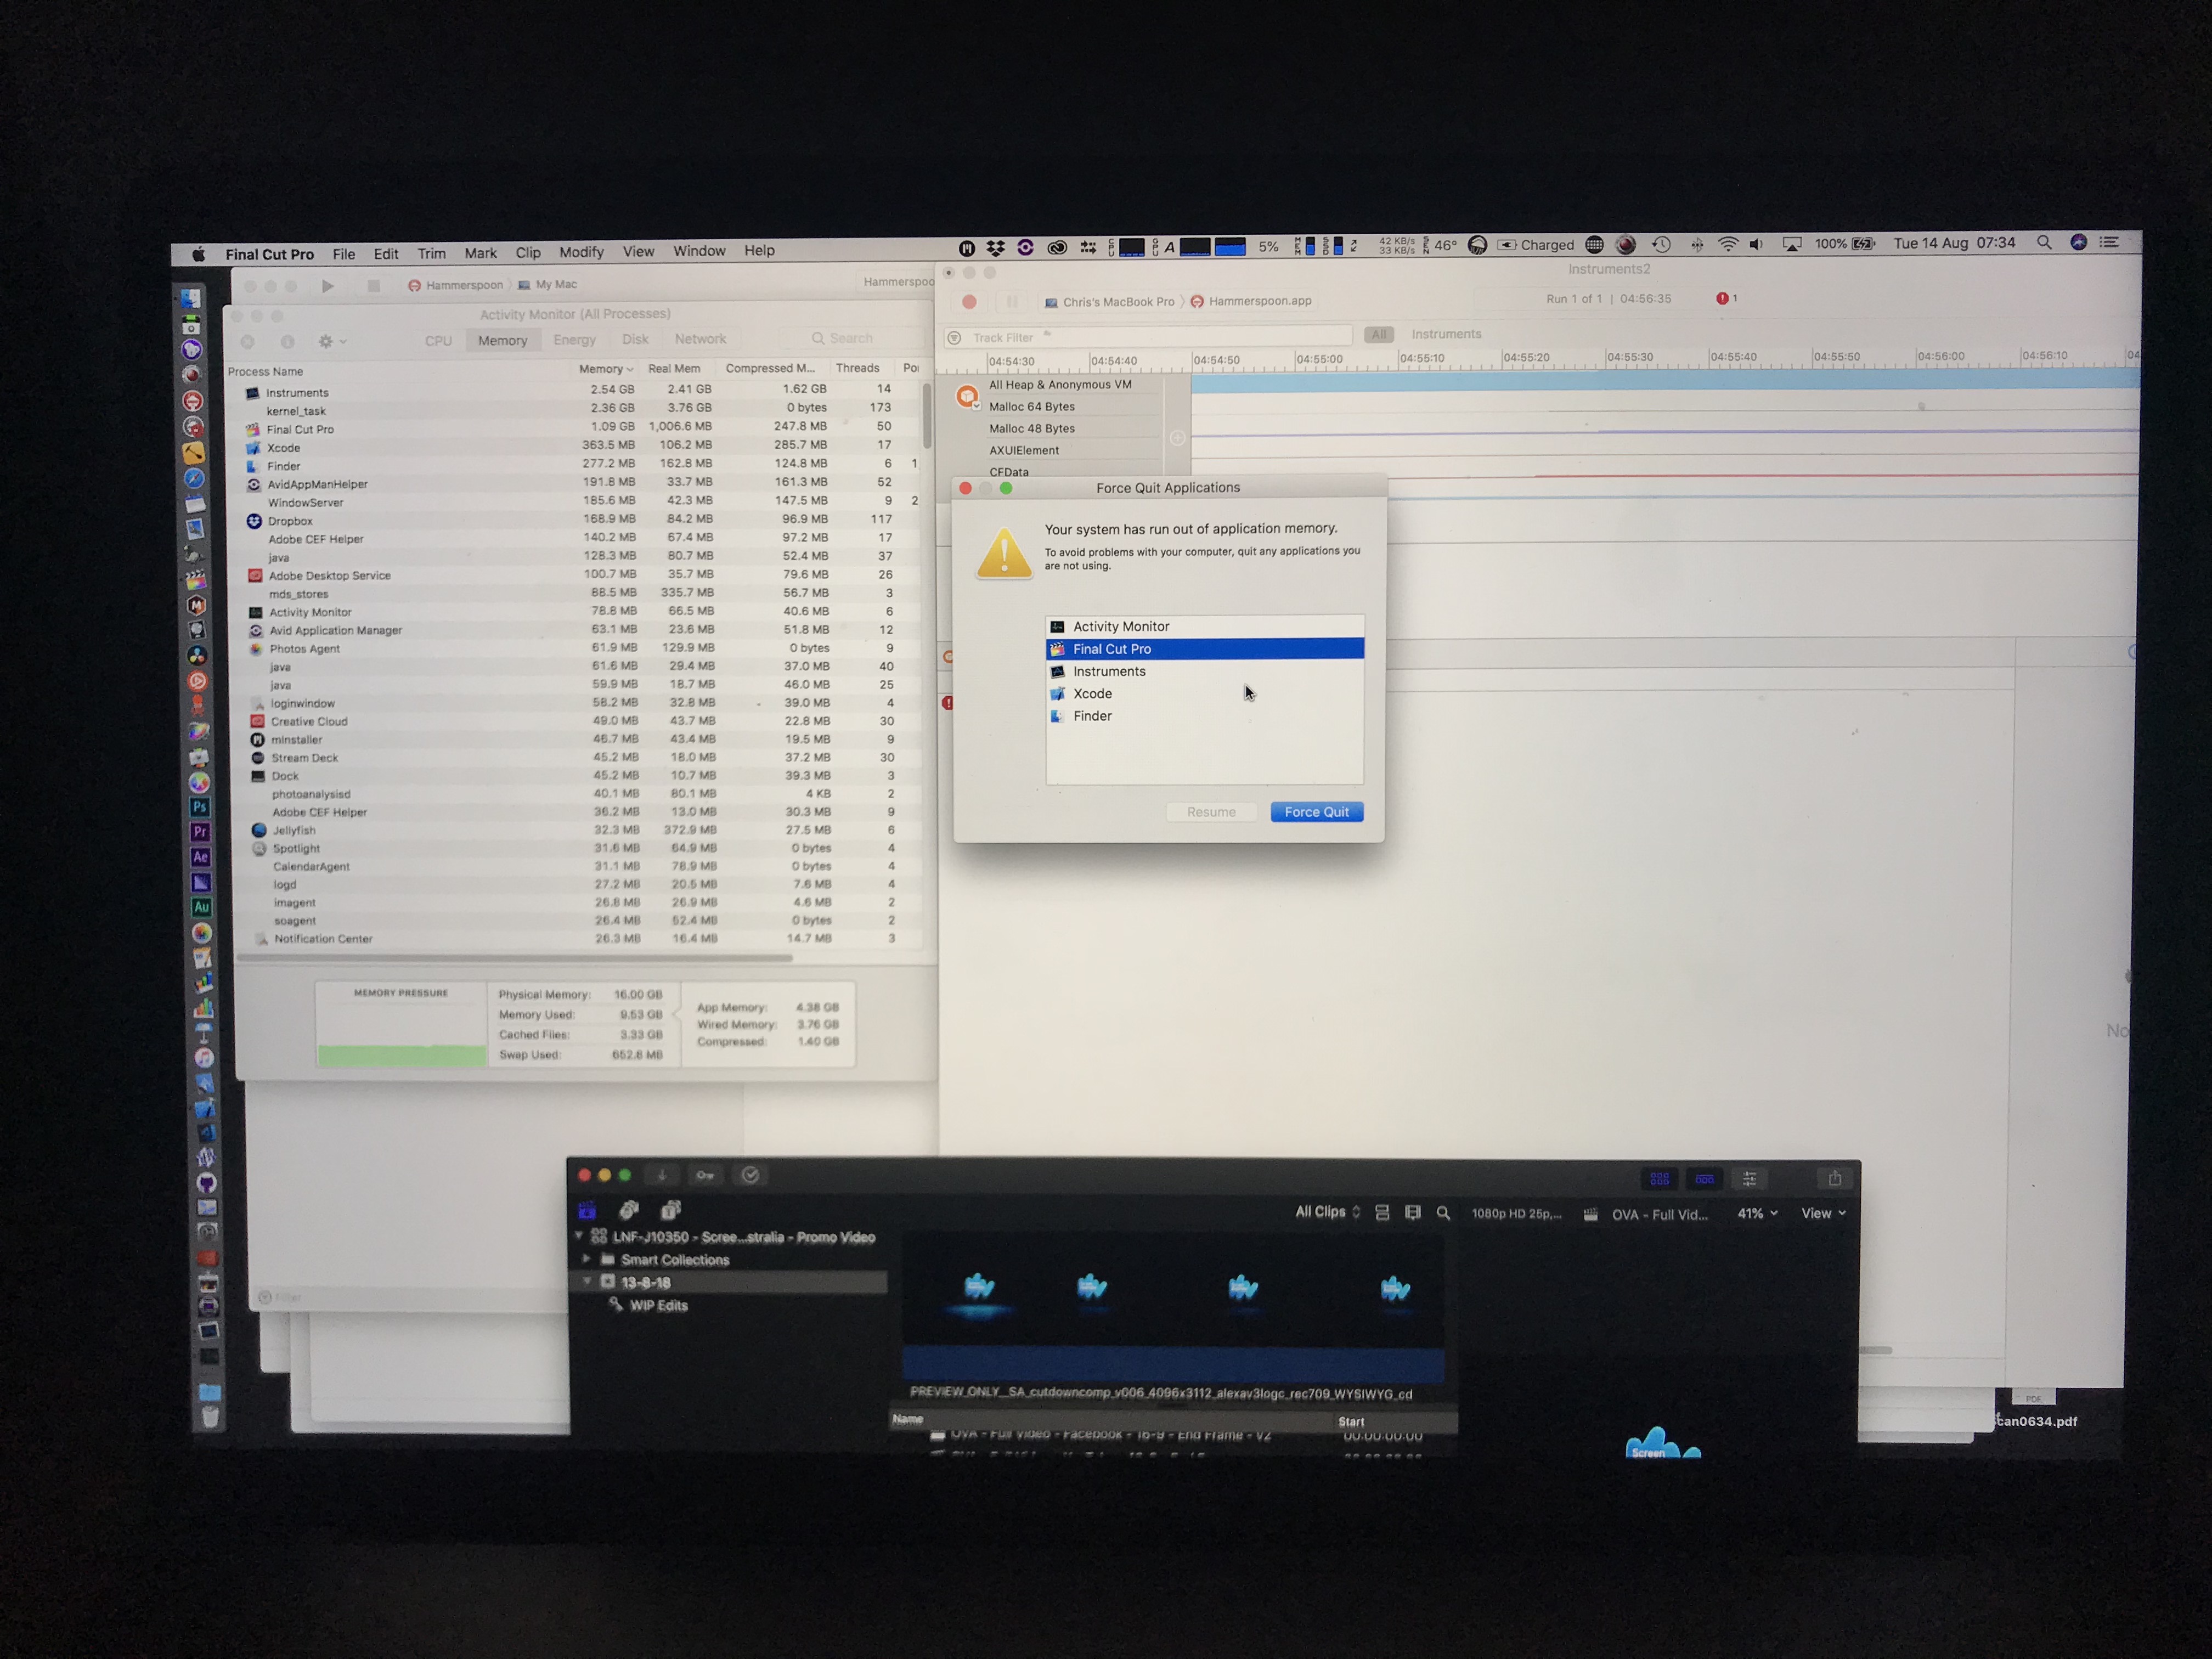
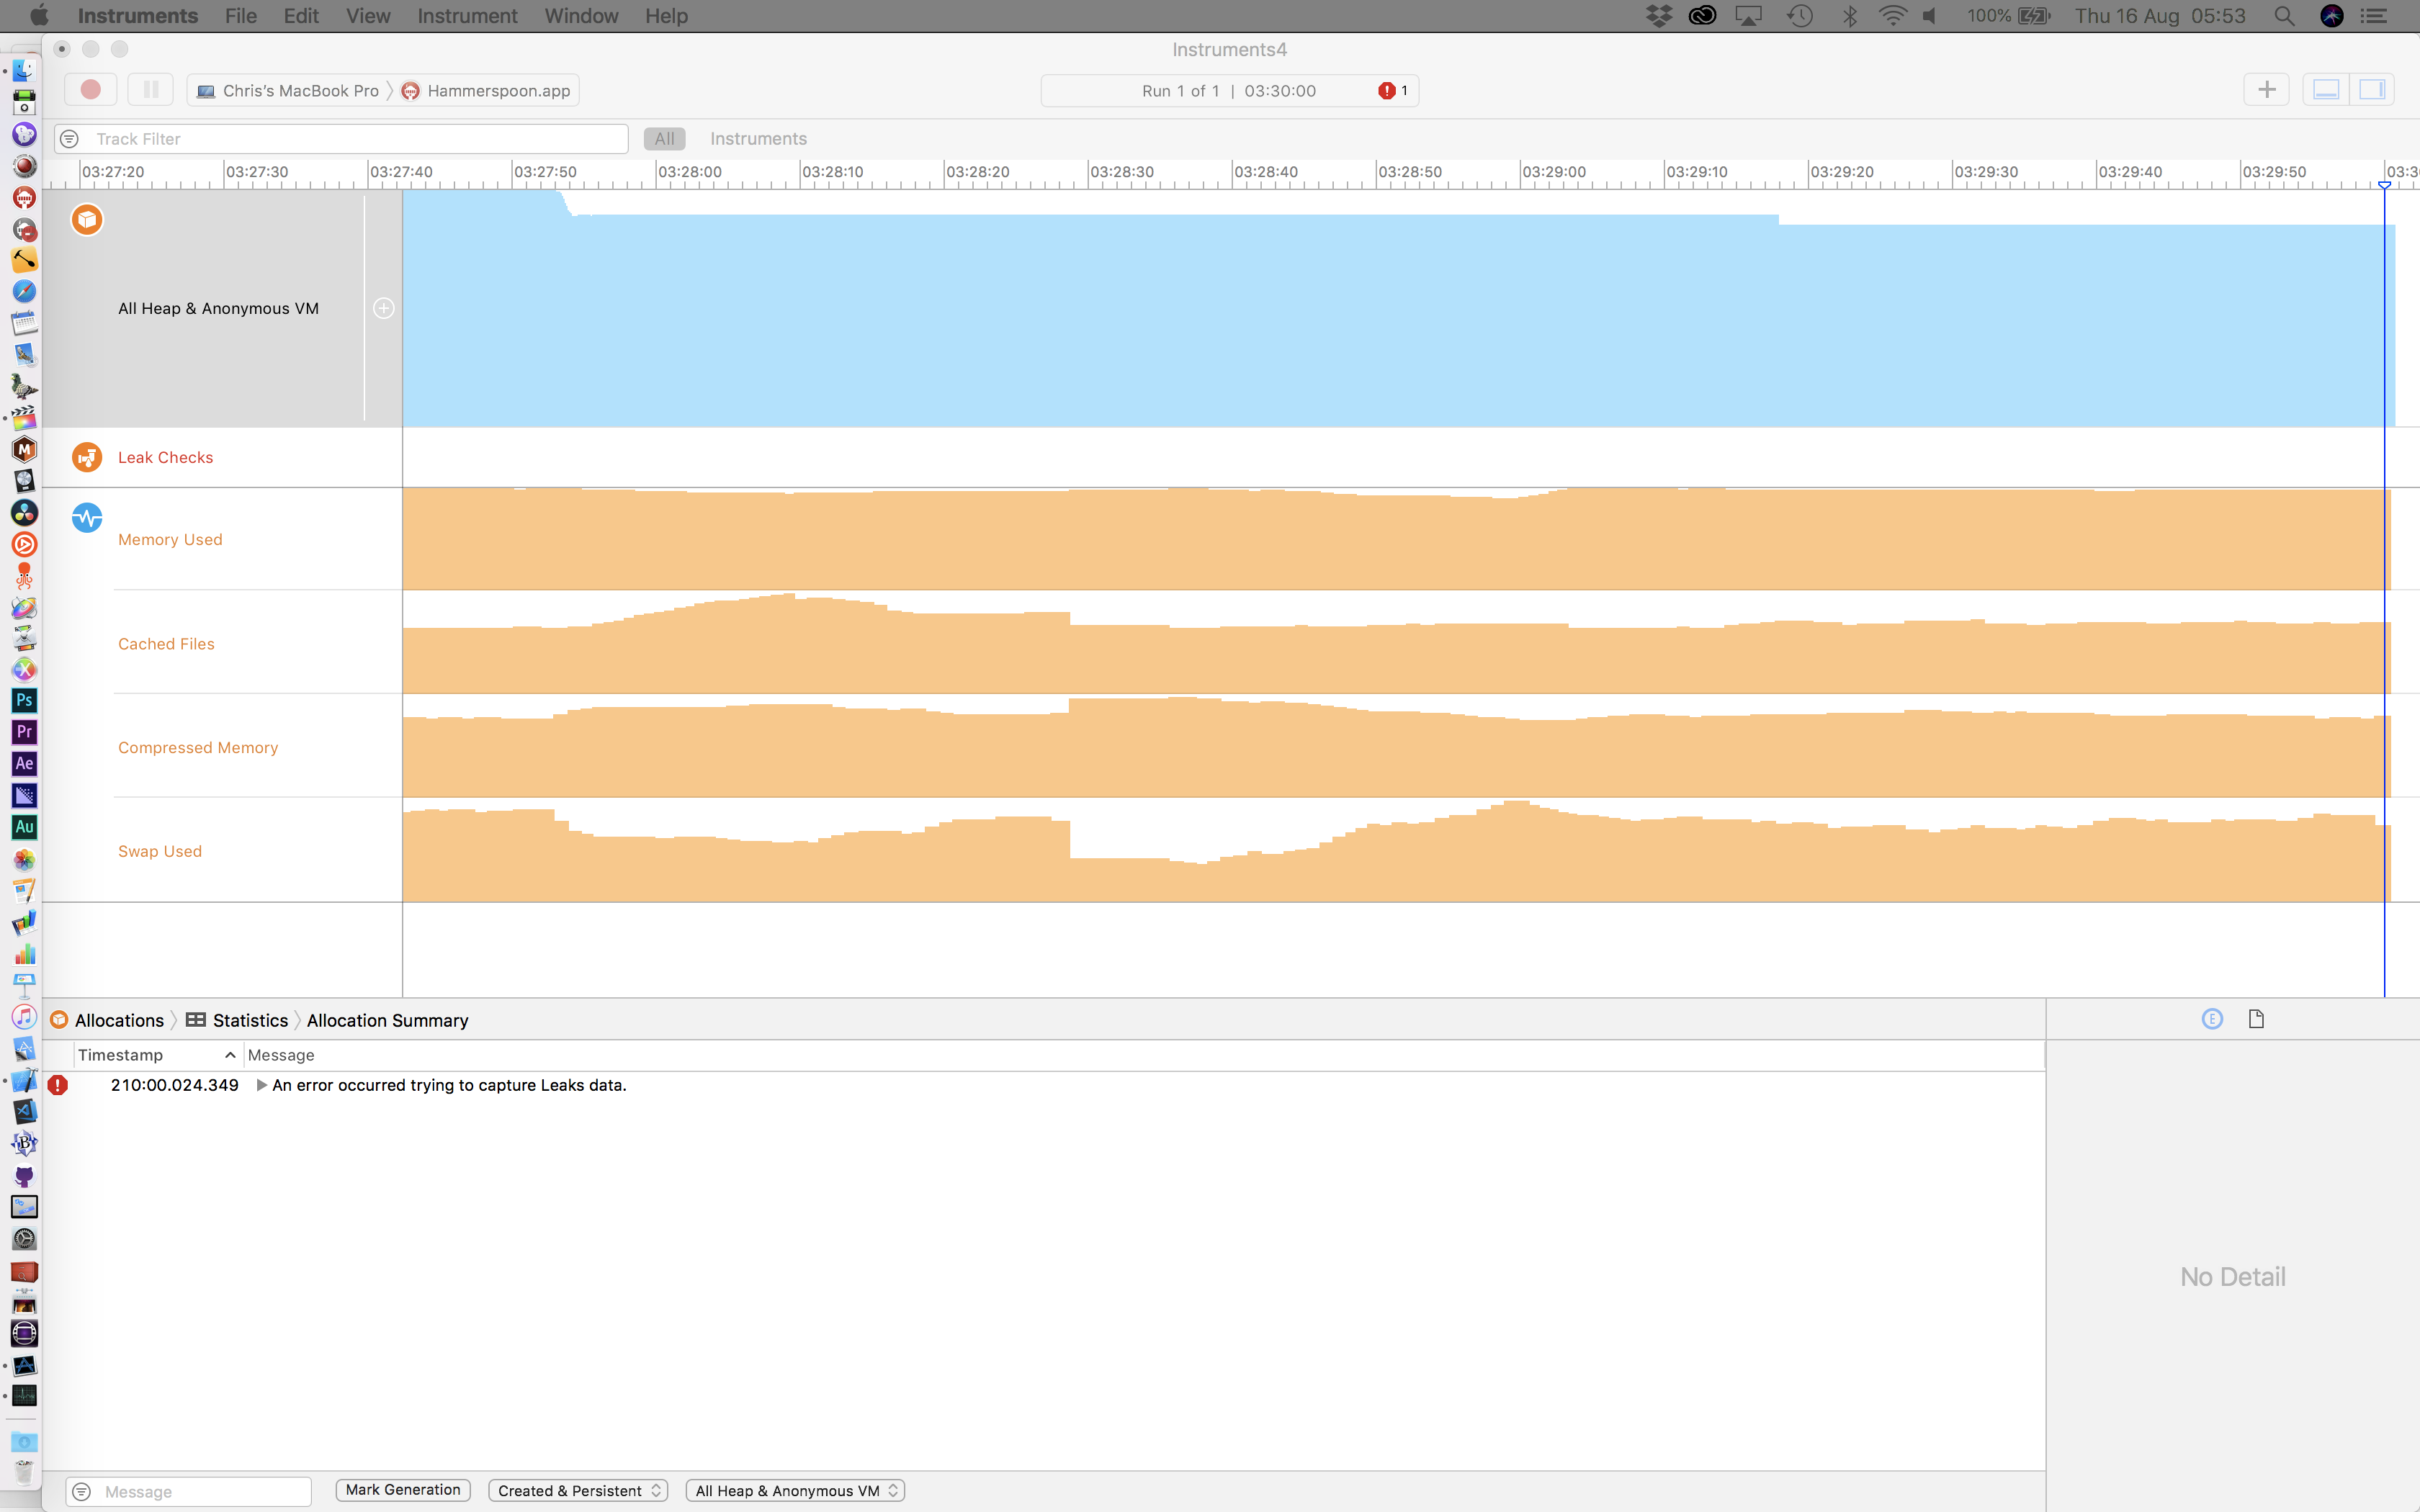
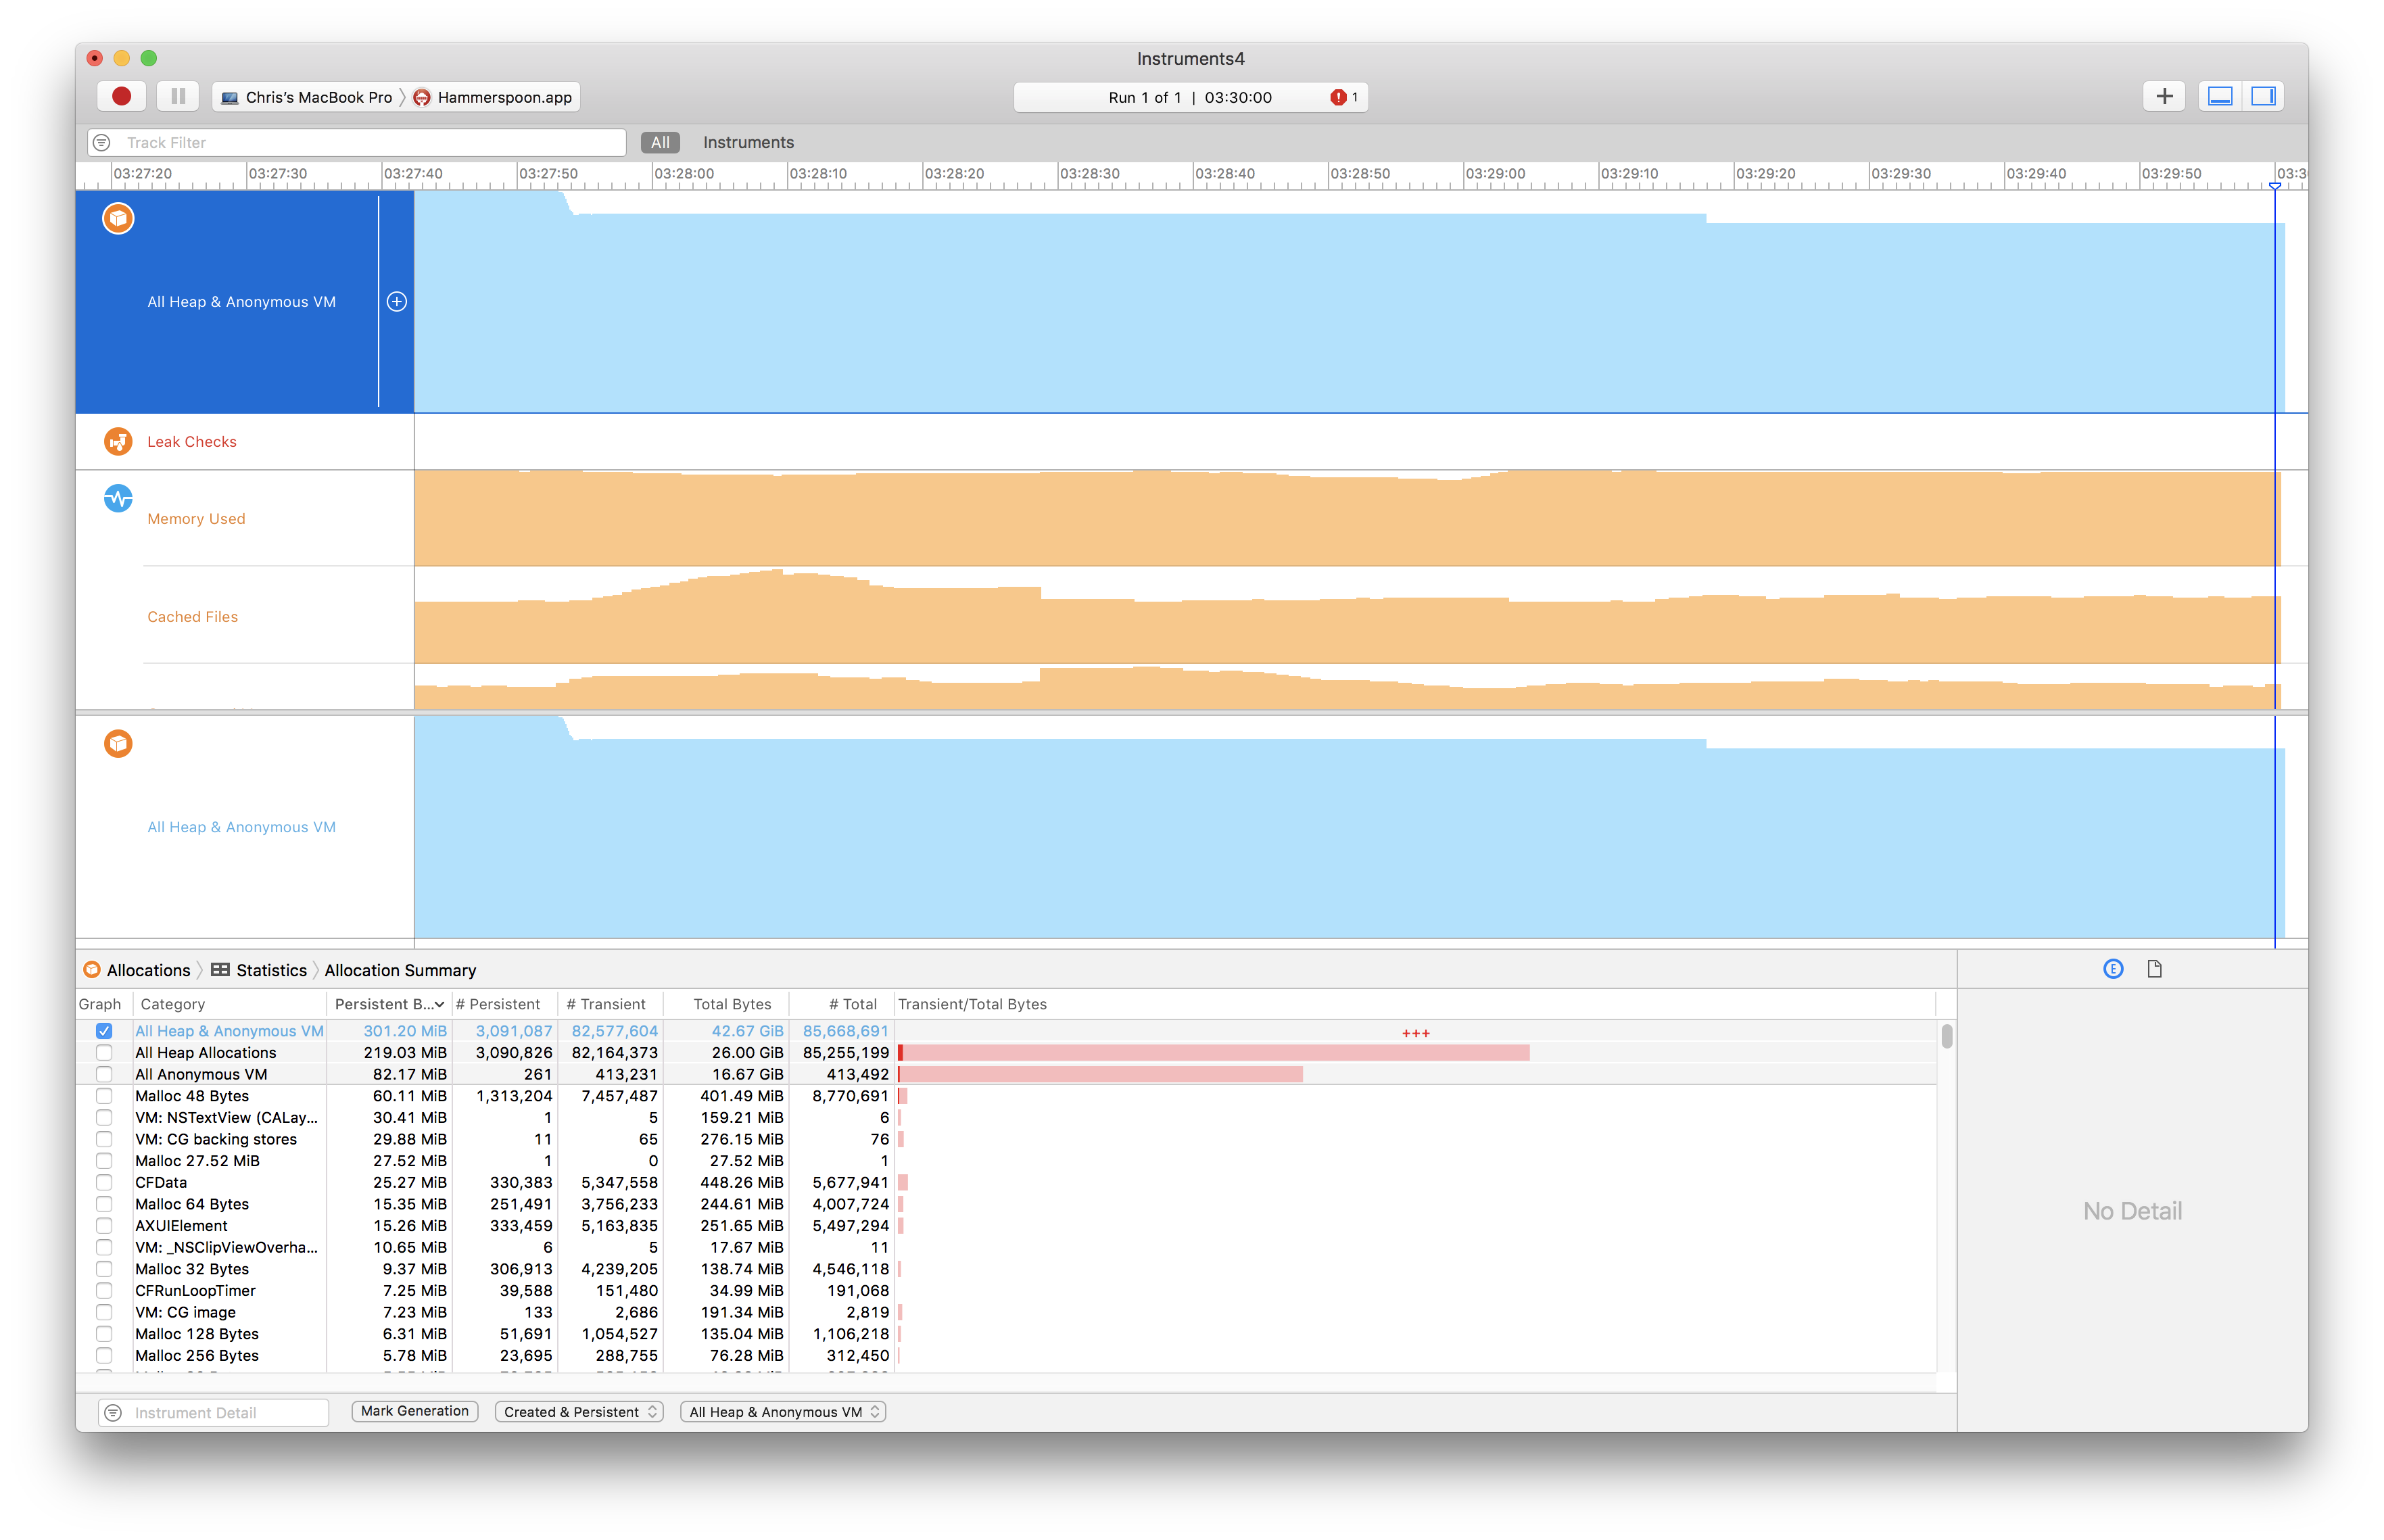
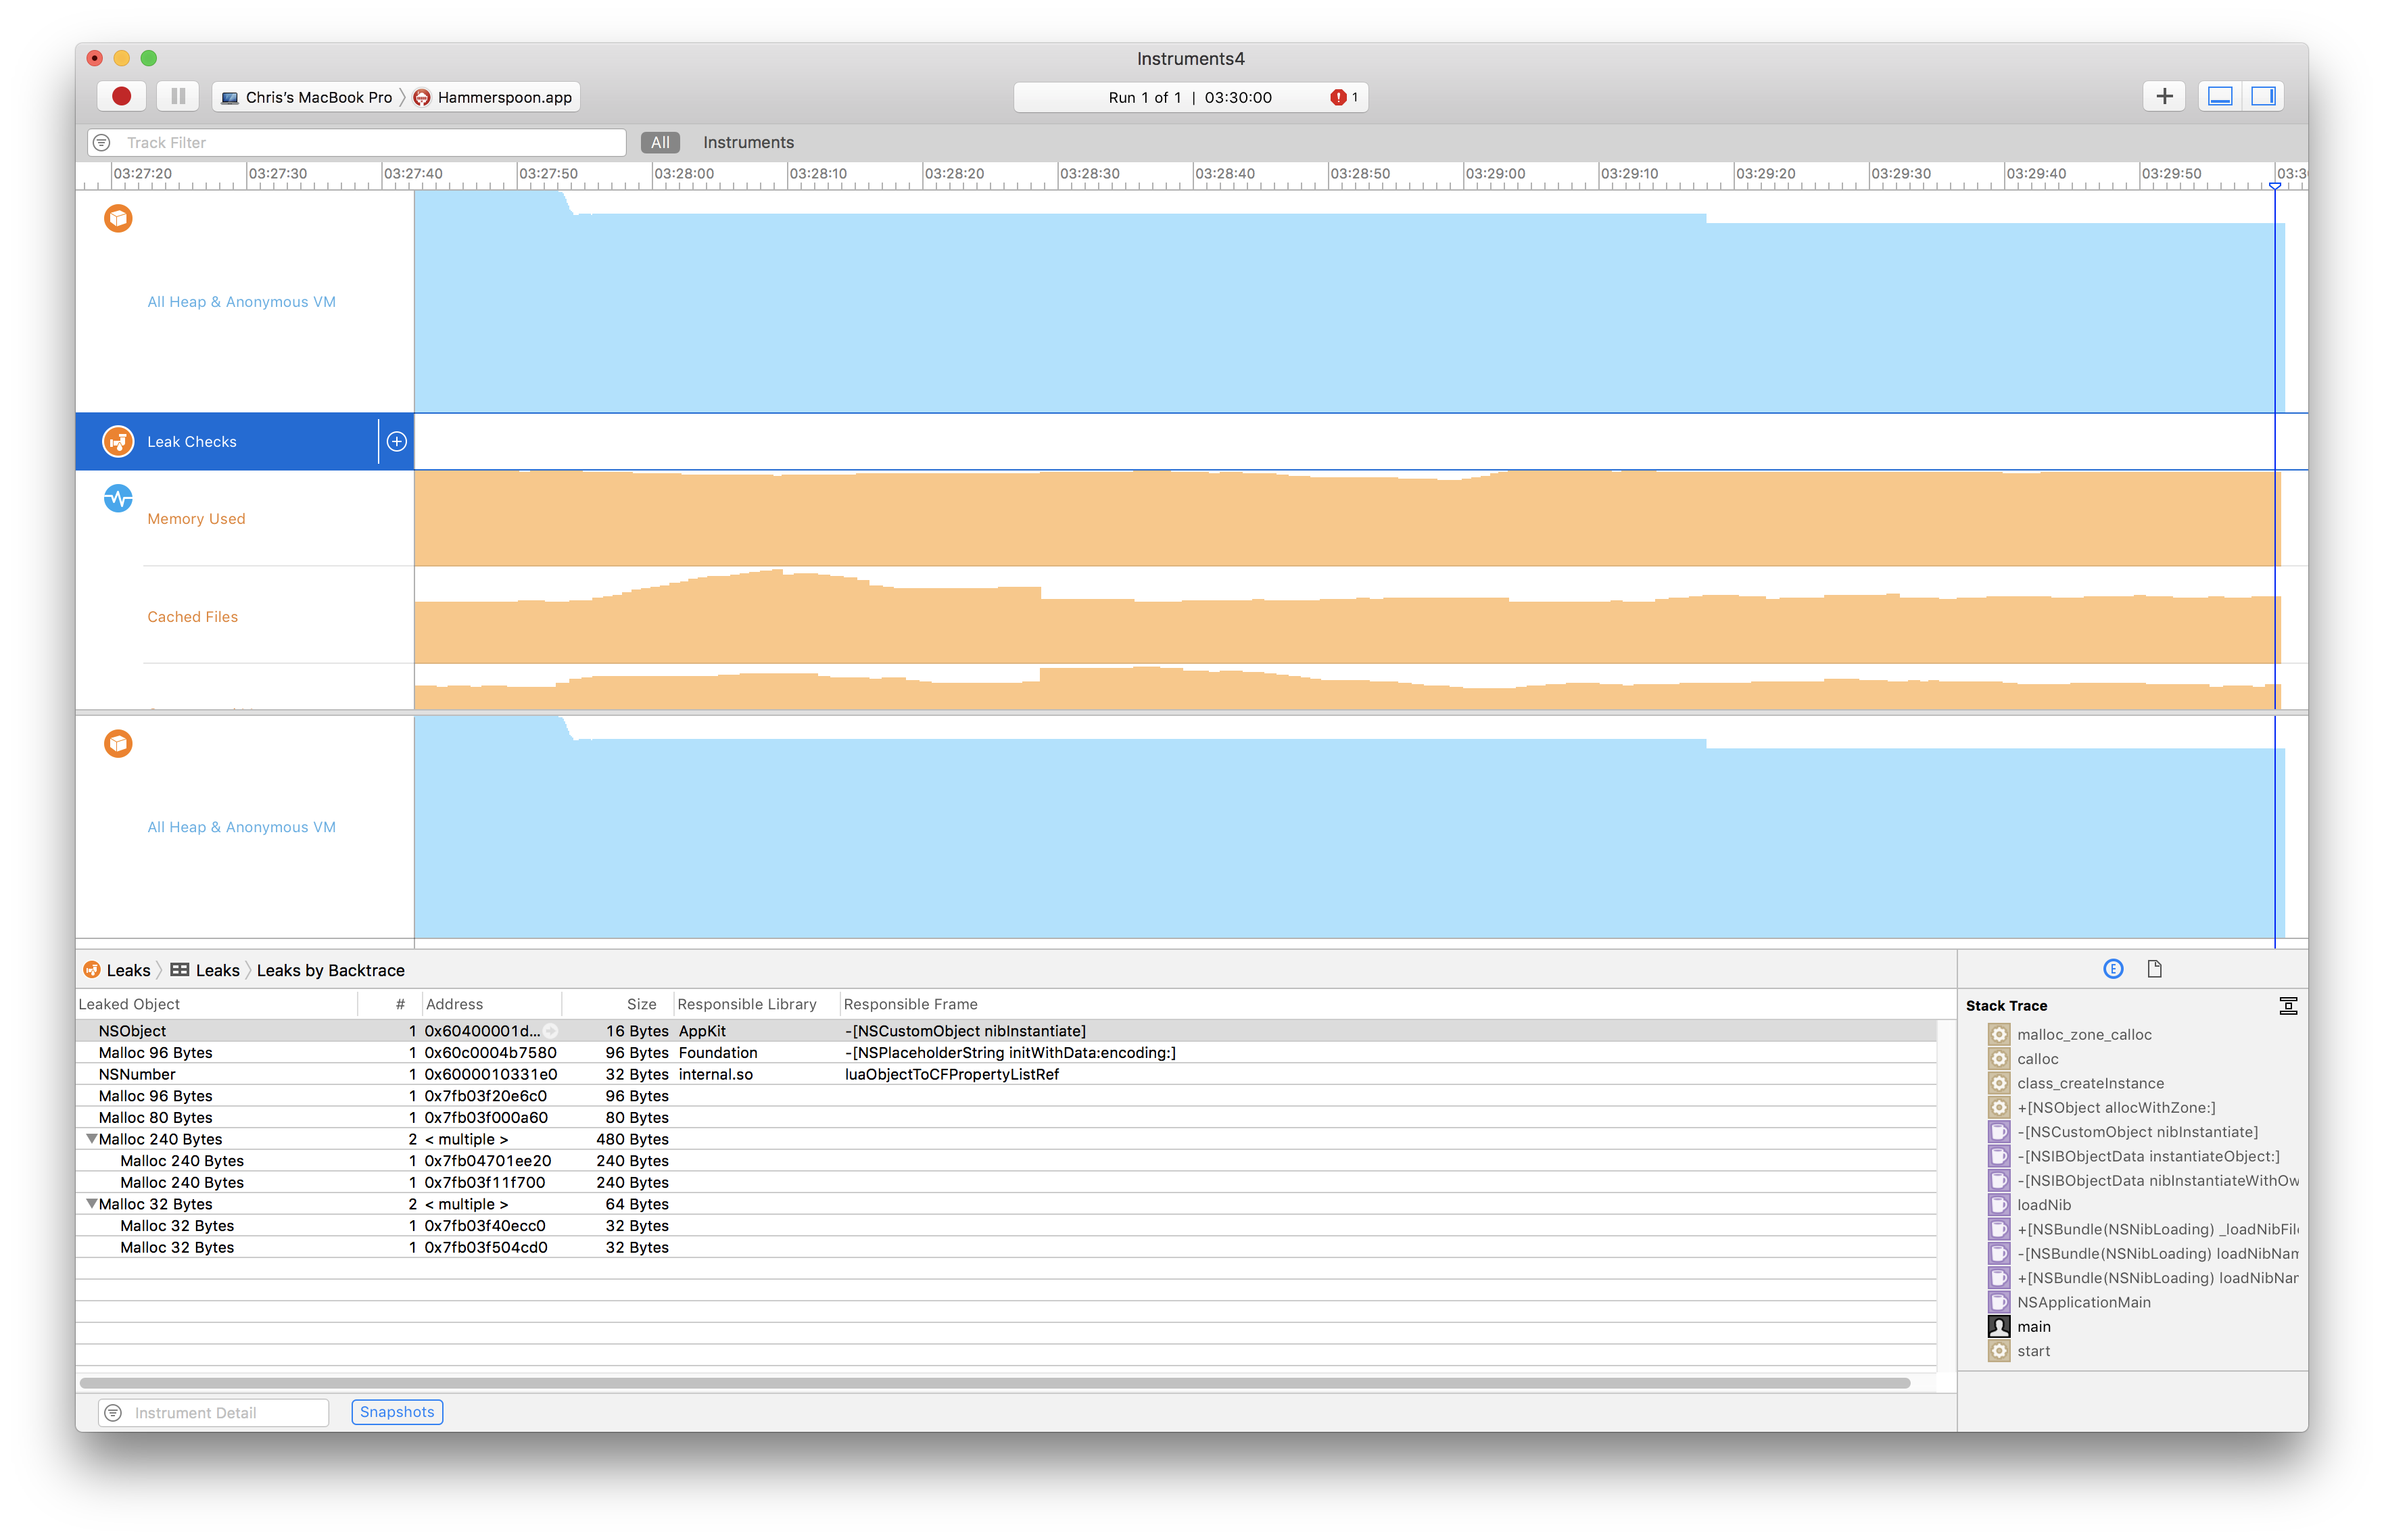
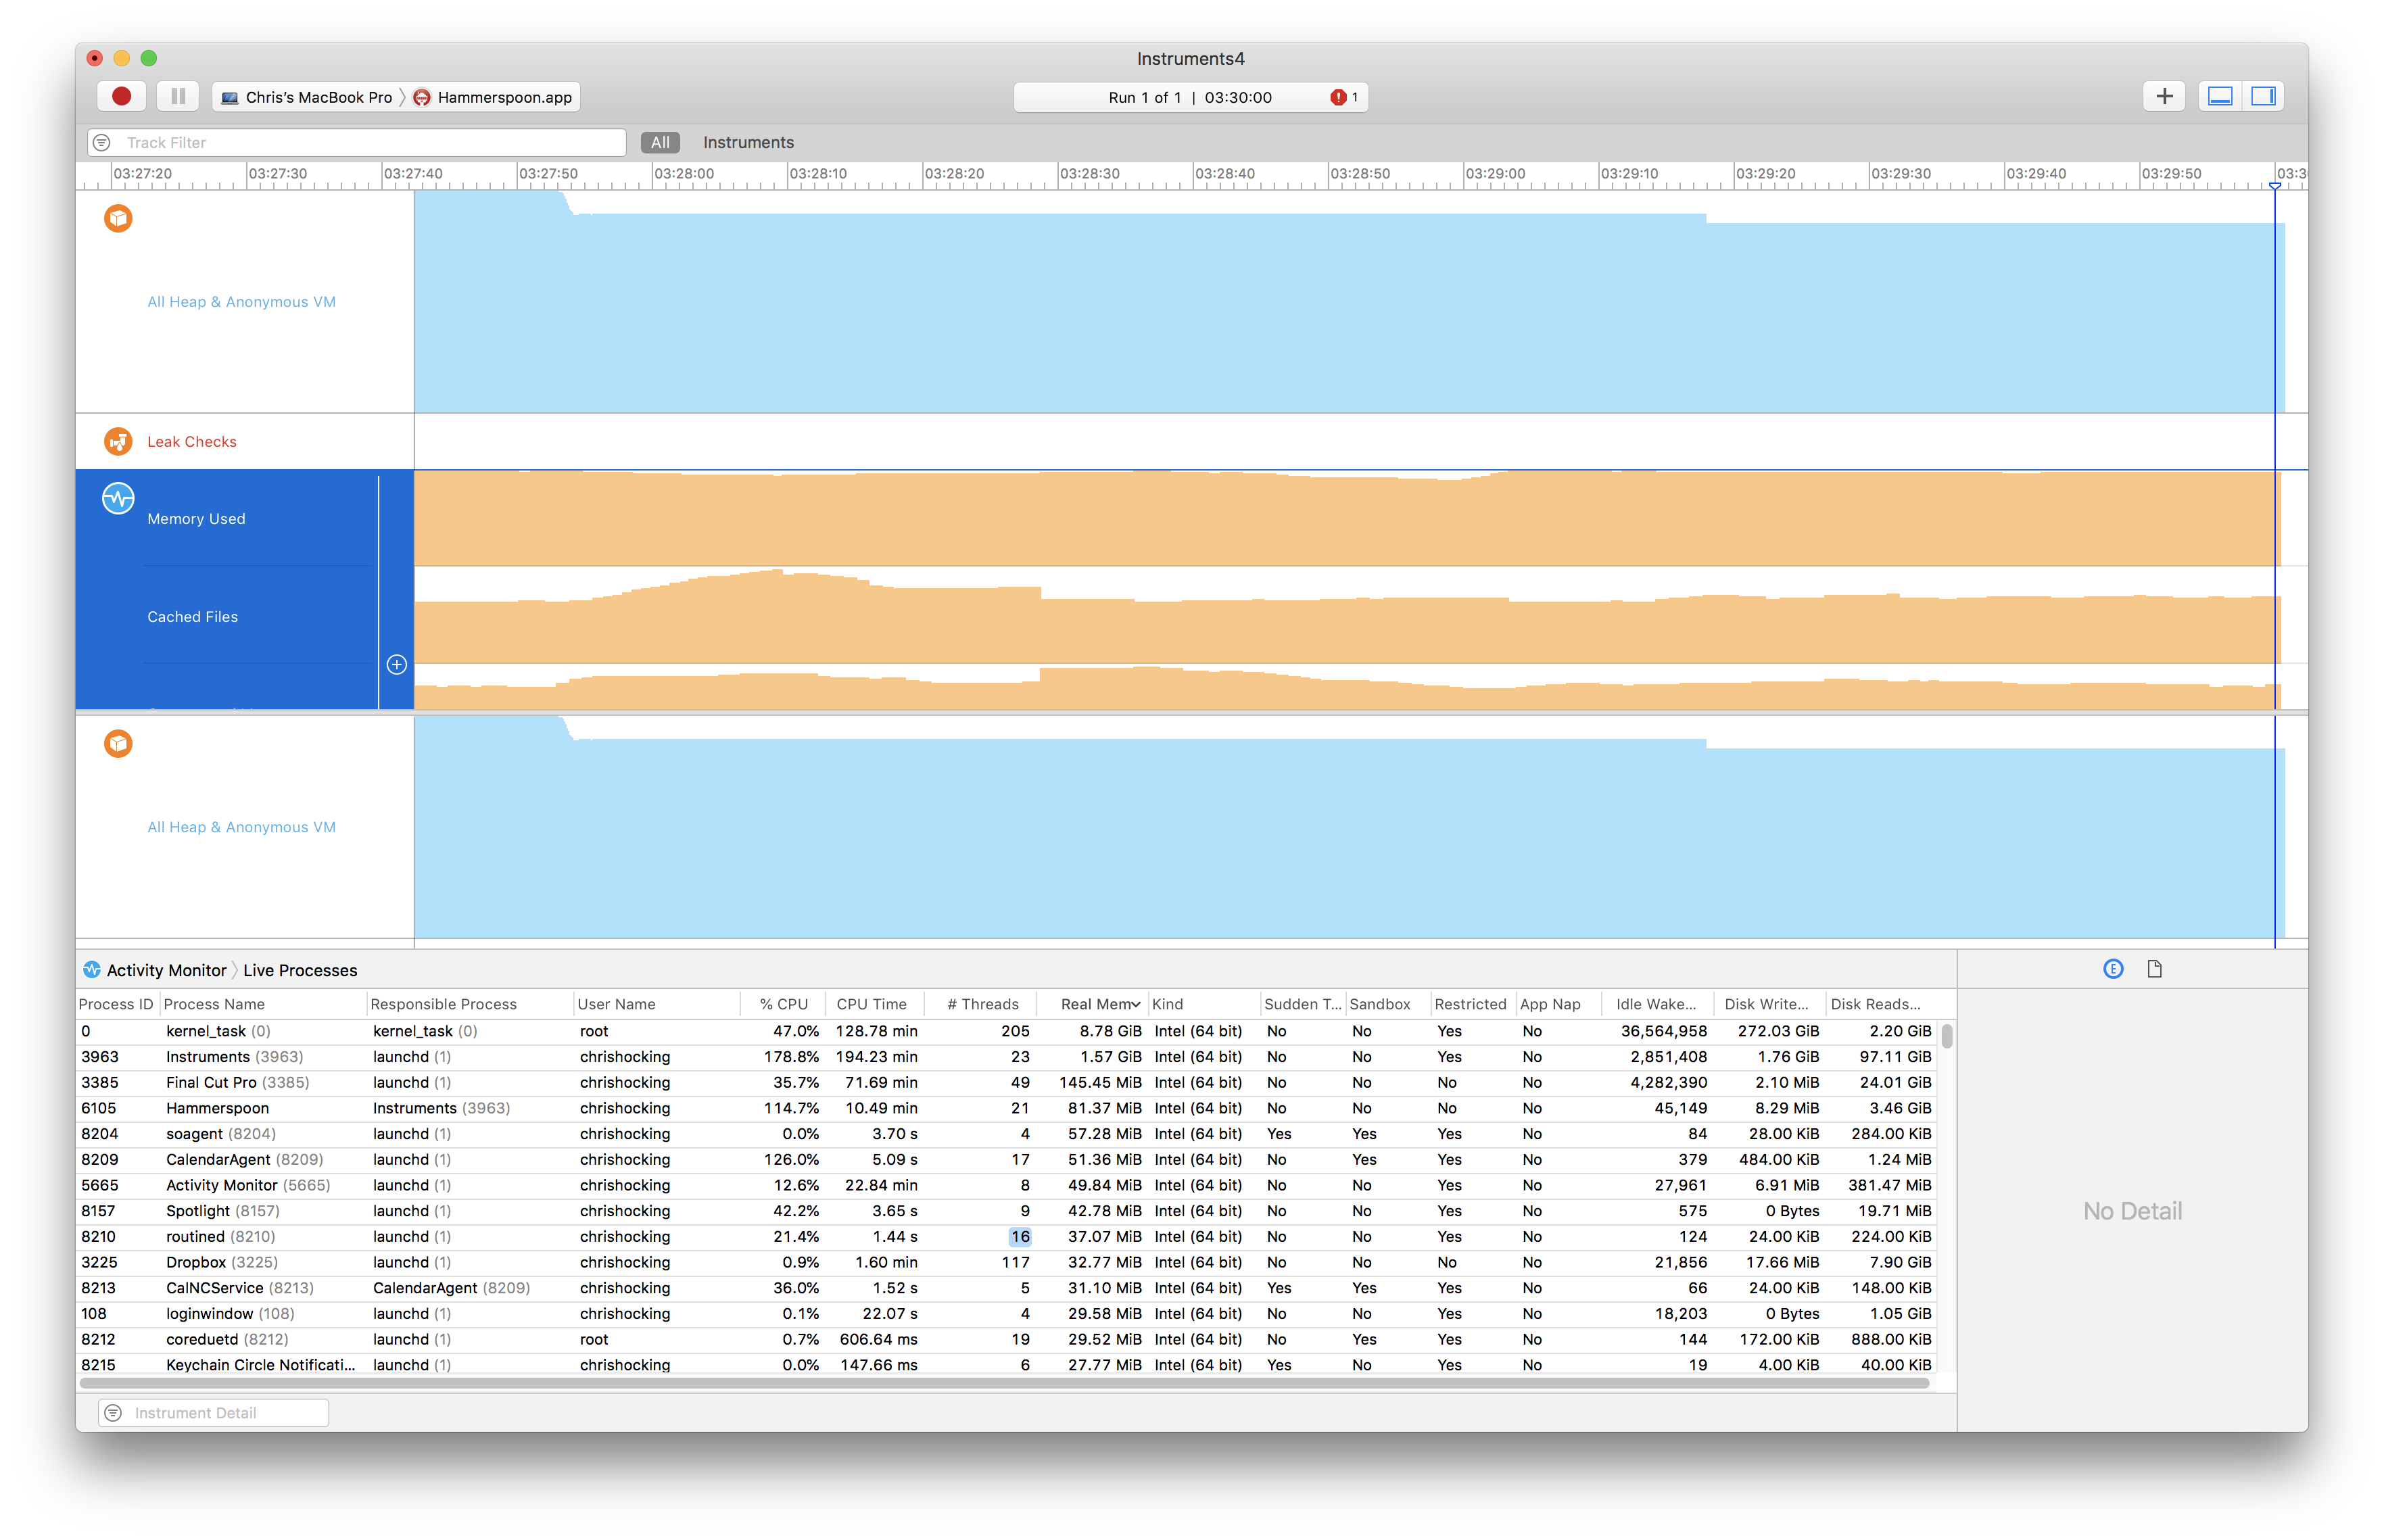
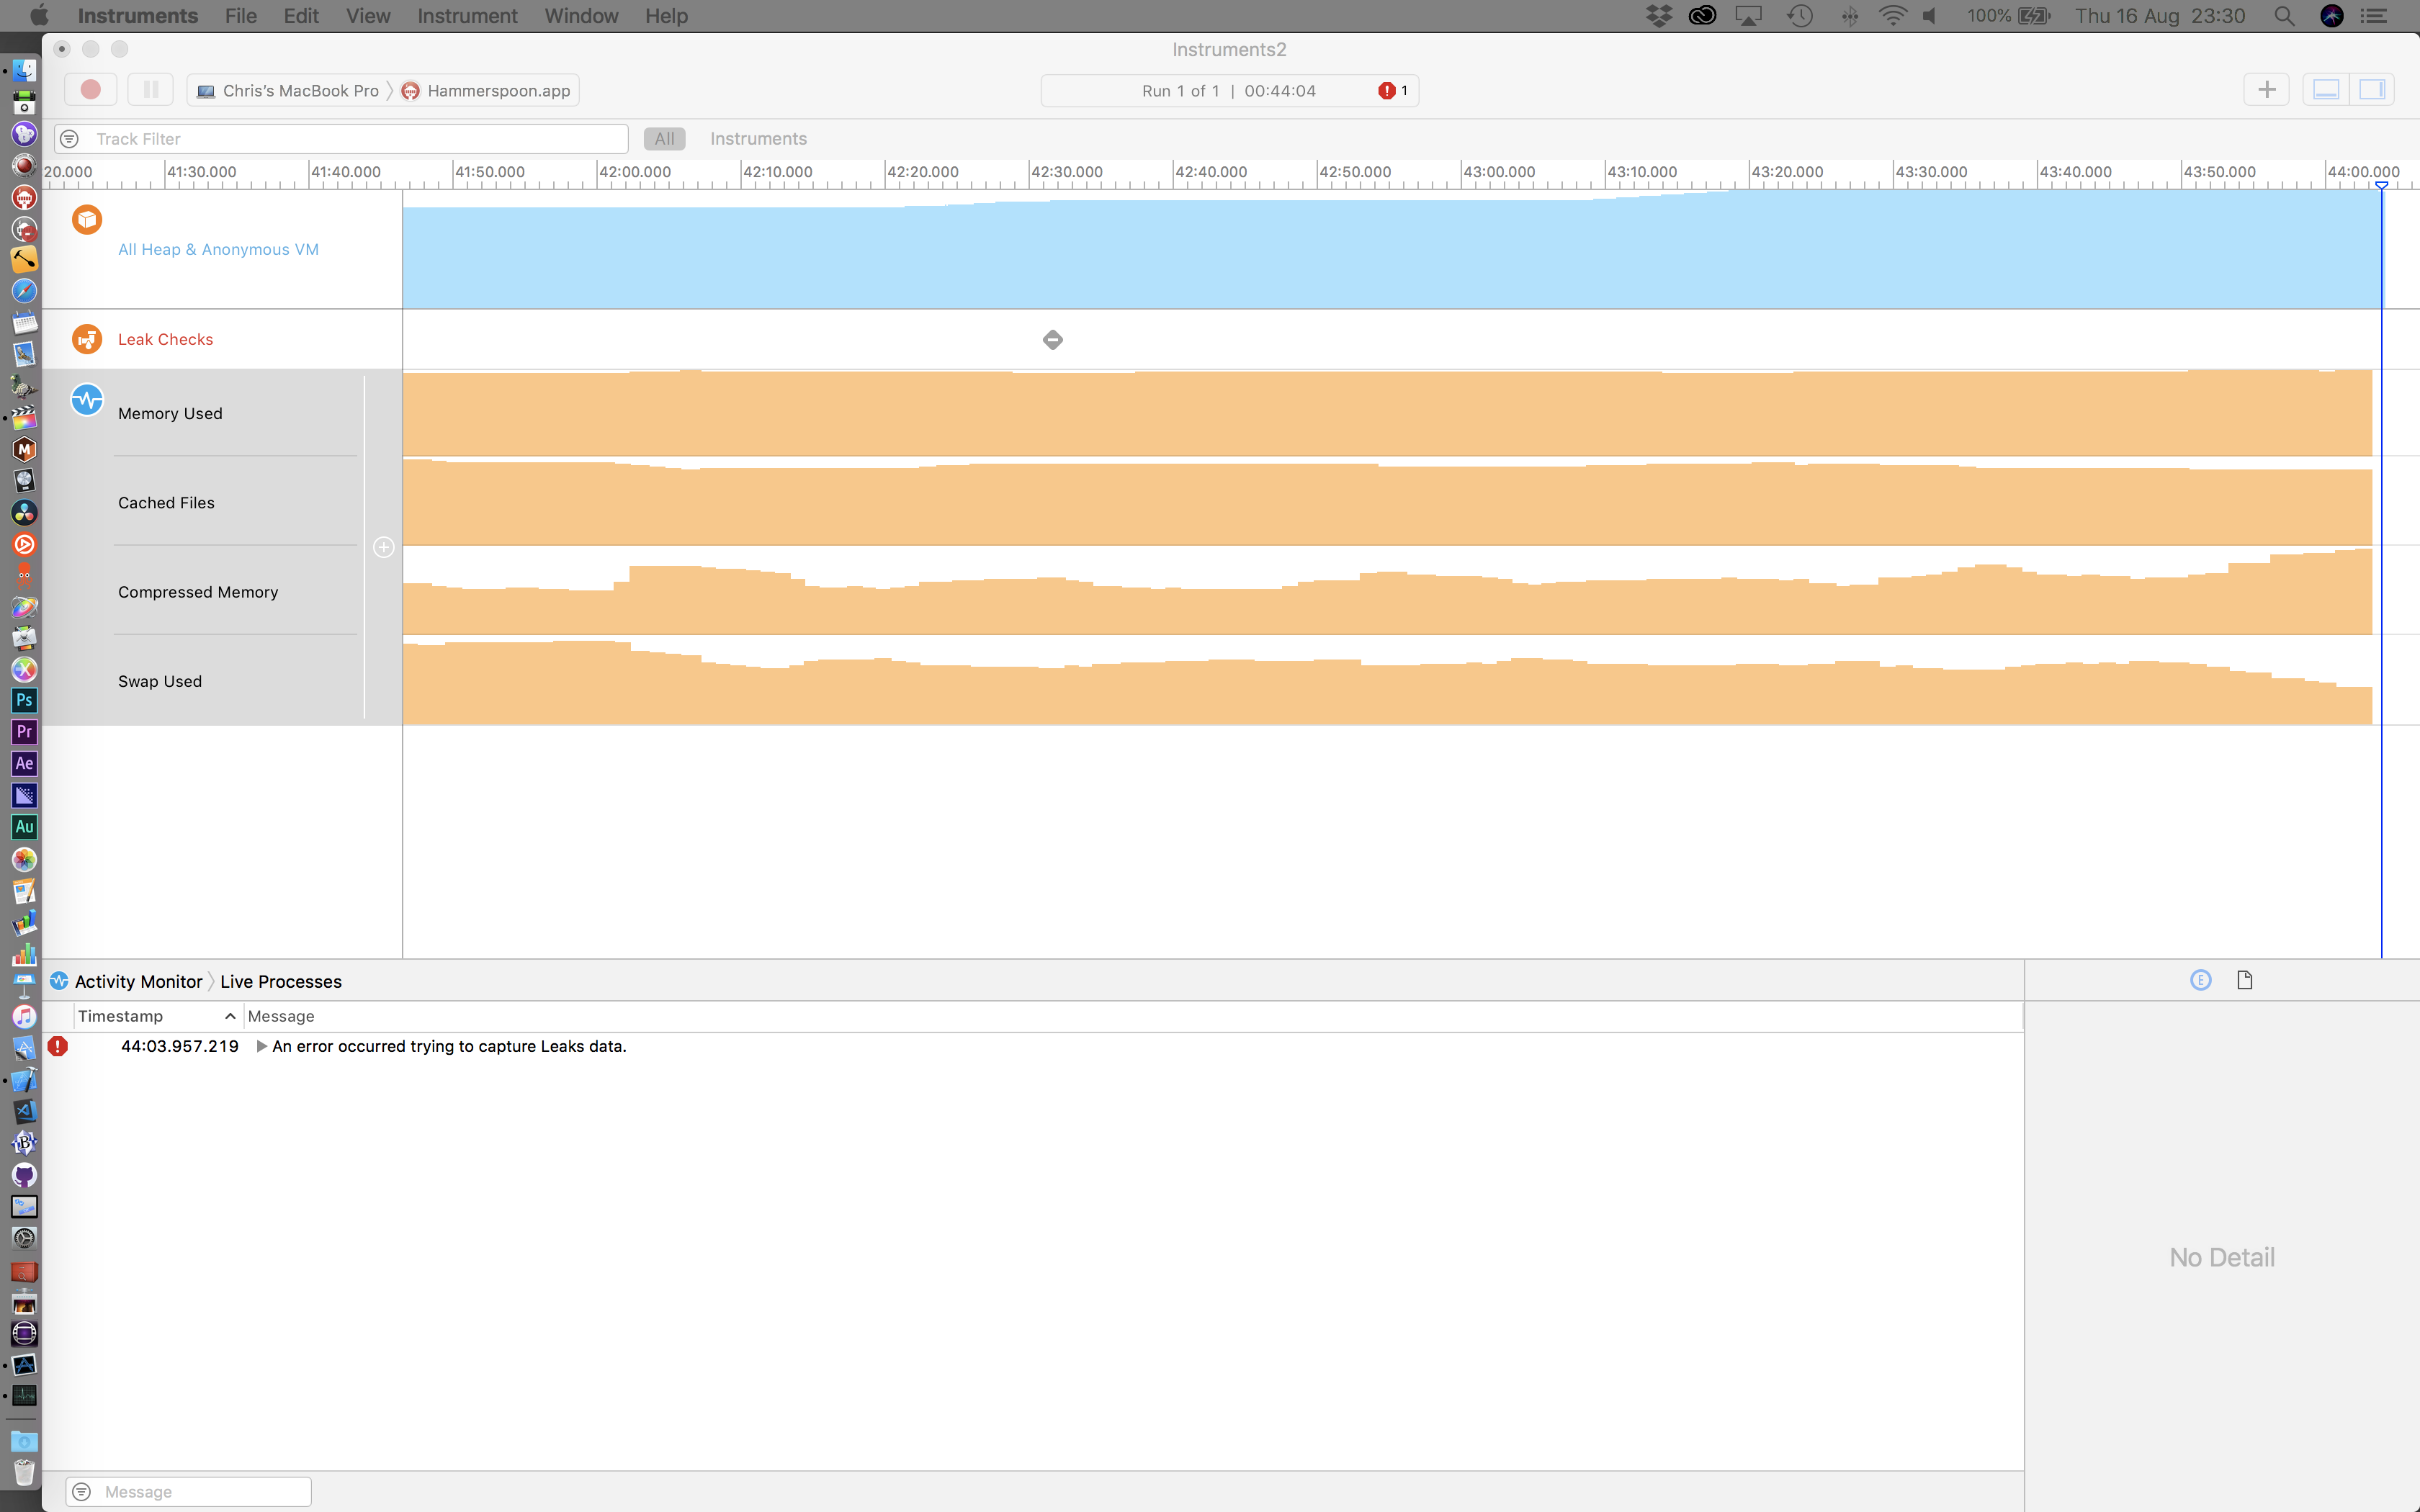
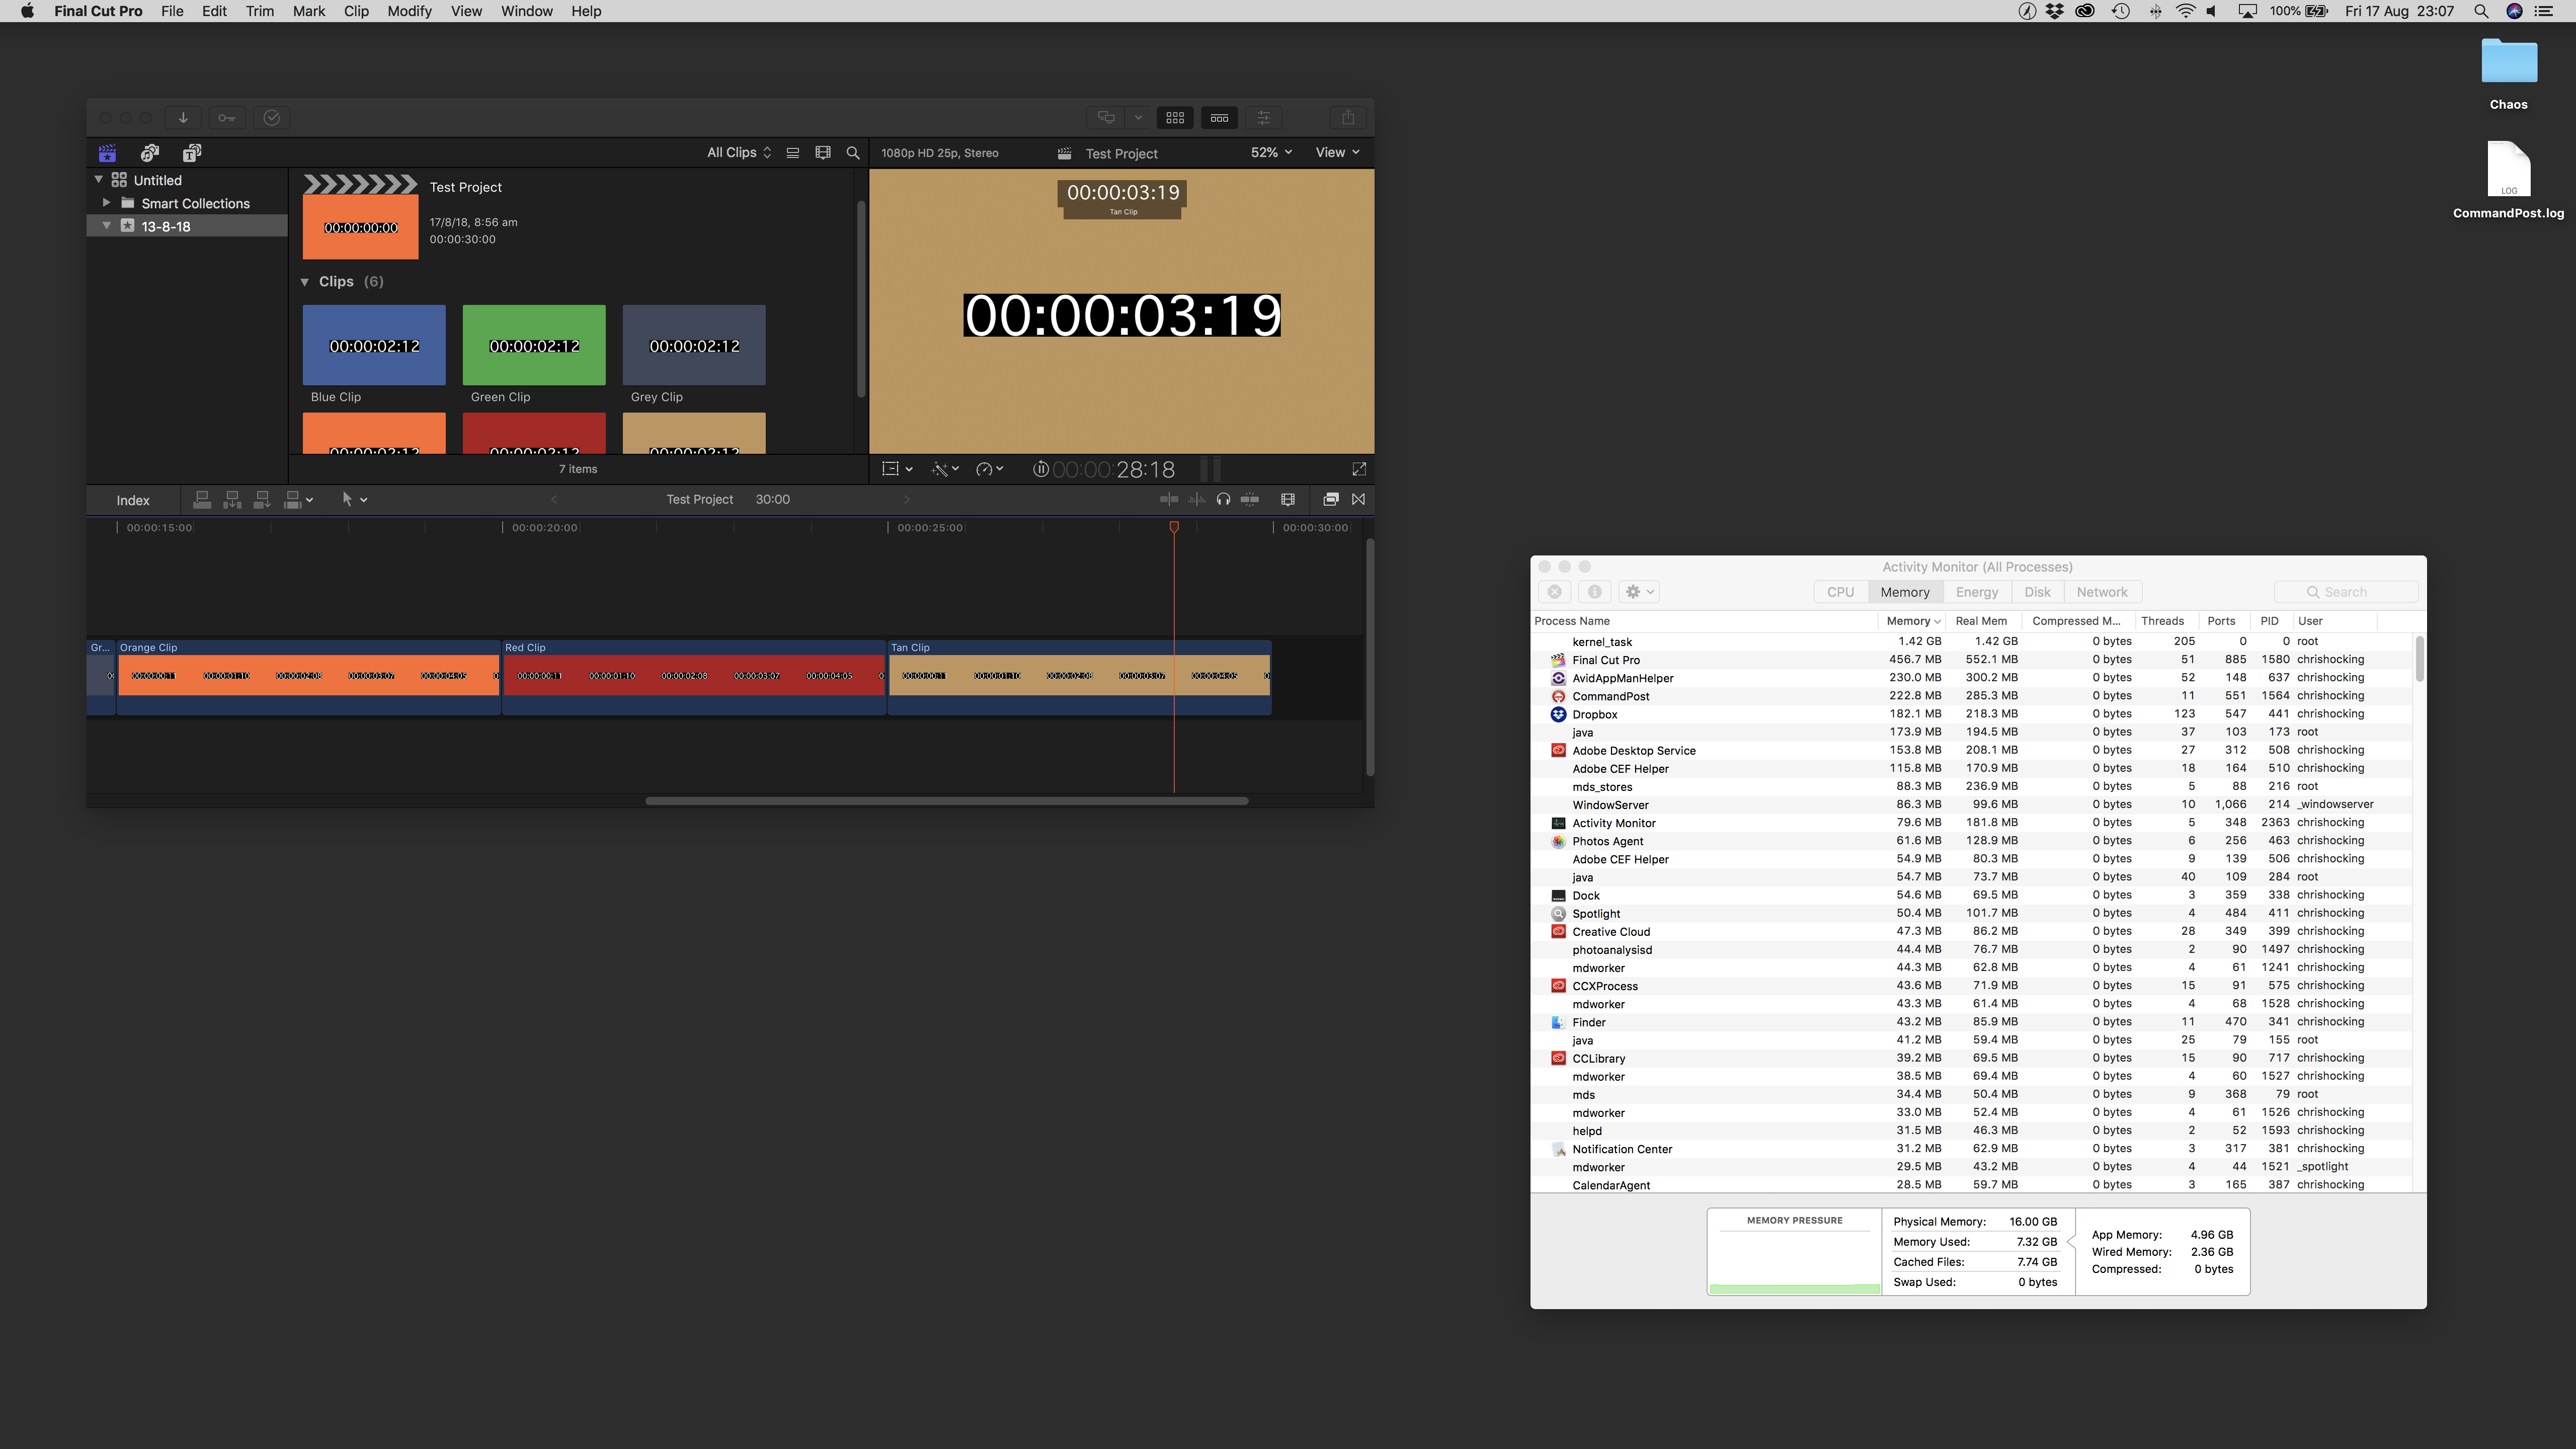
end)When I came back to it 04:56:35 later, I was presented with the dreaded "Out of application memory" error - although Activity Monitor looked fine - but Xcode Instruments had stopped because "An error occurred trying to capture Leaks data - Error retrieving leak information". Here's a photo of what my computer looked like when I came back to it:
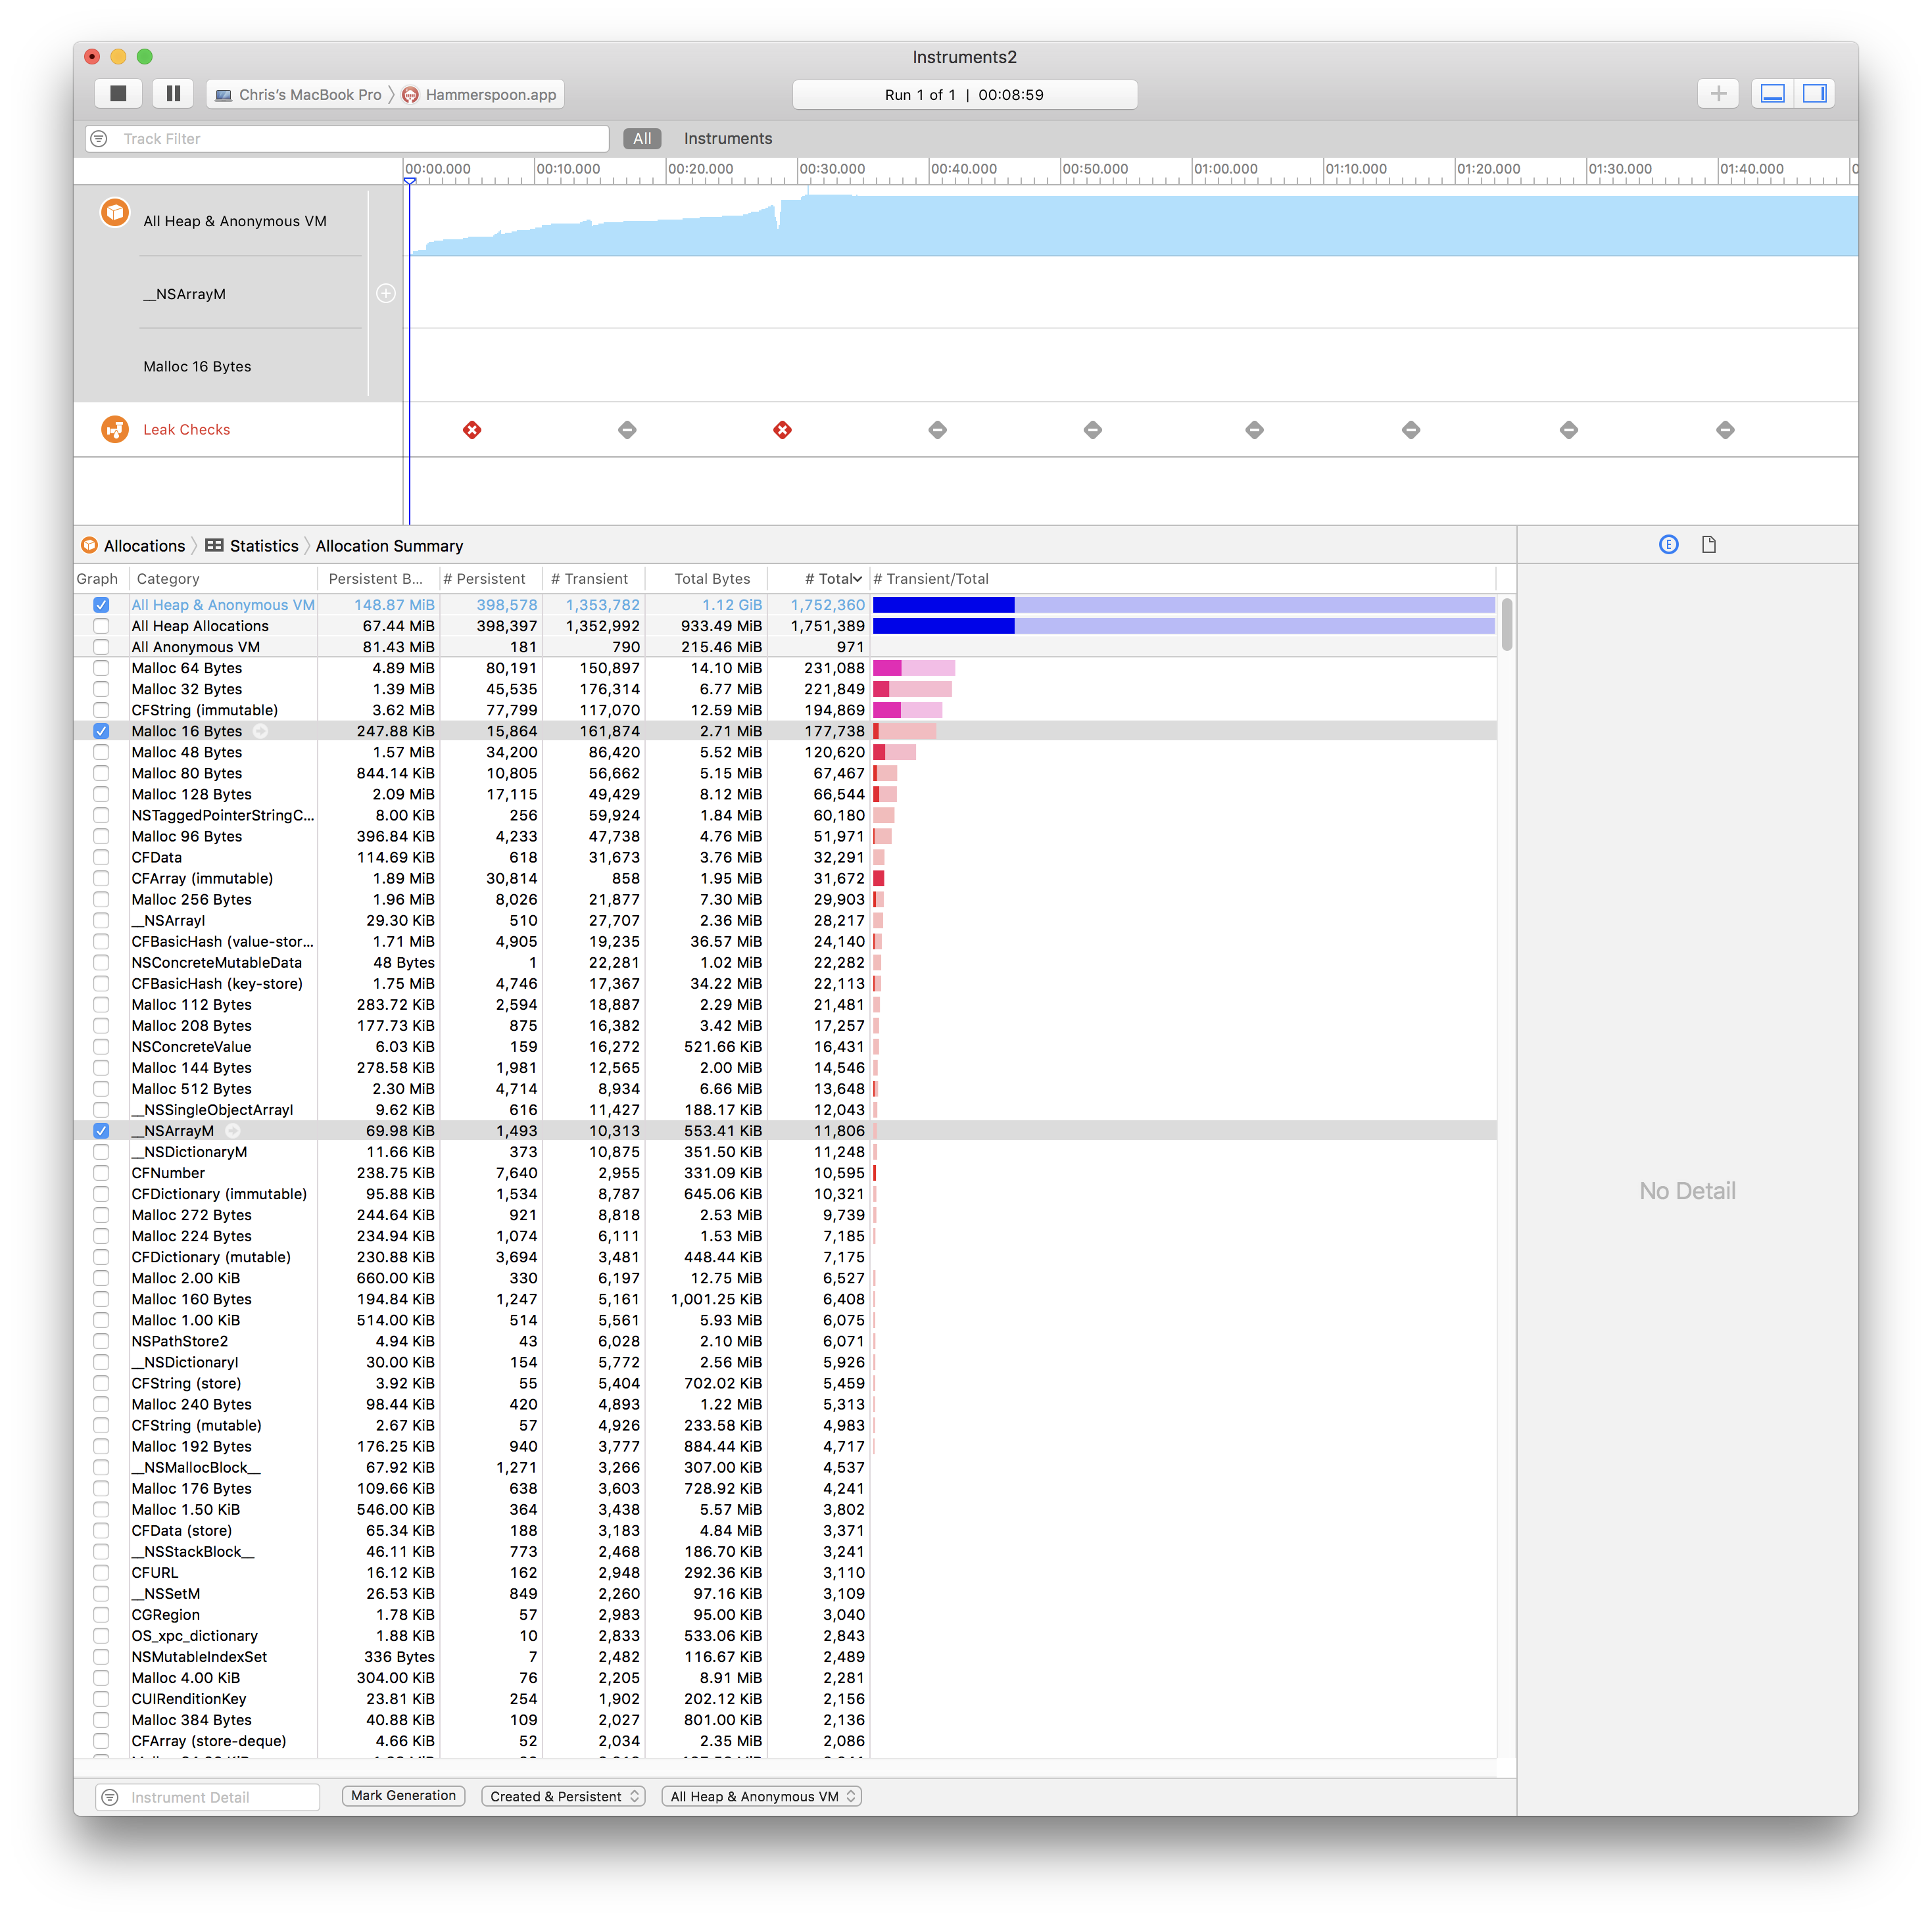
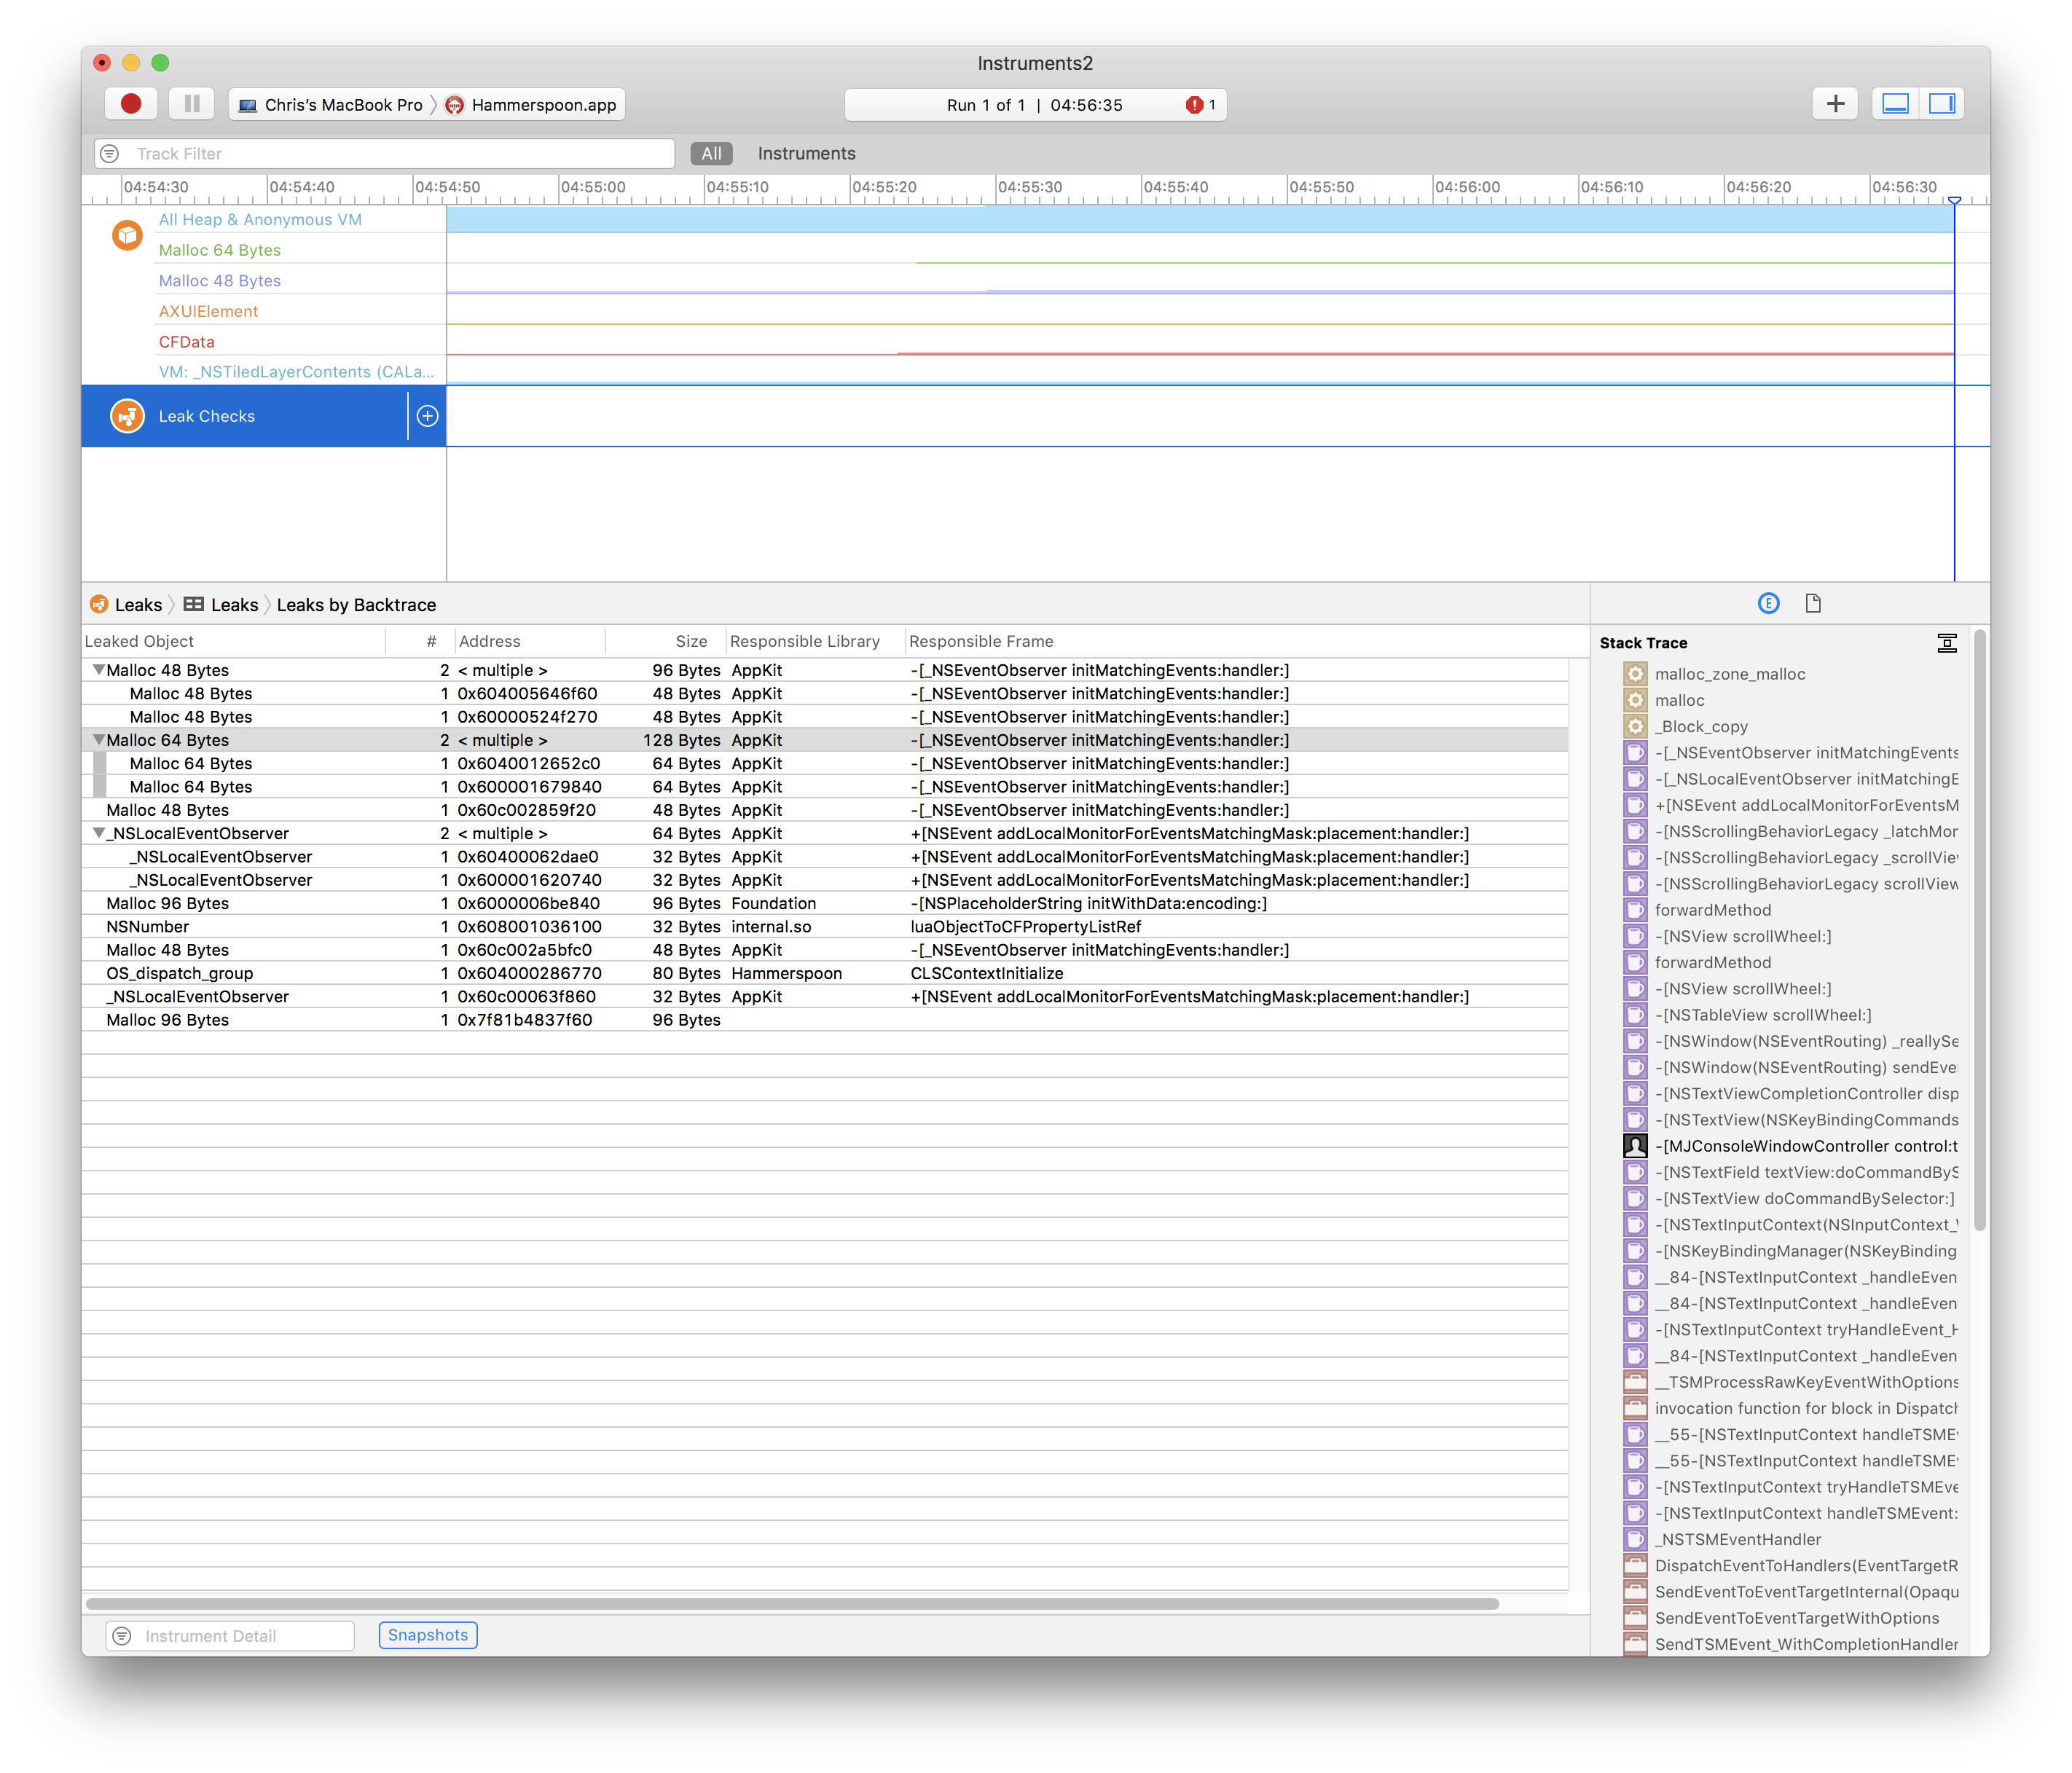
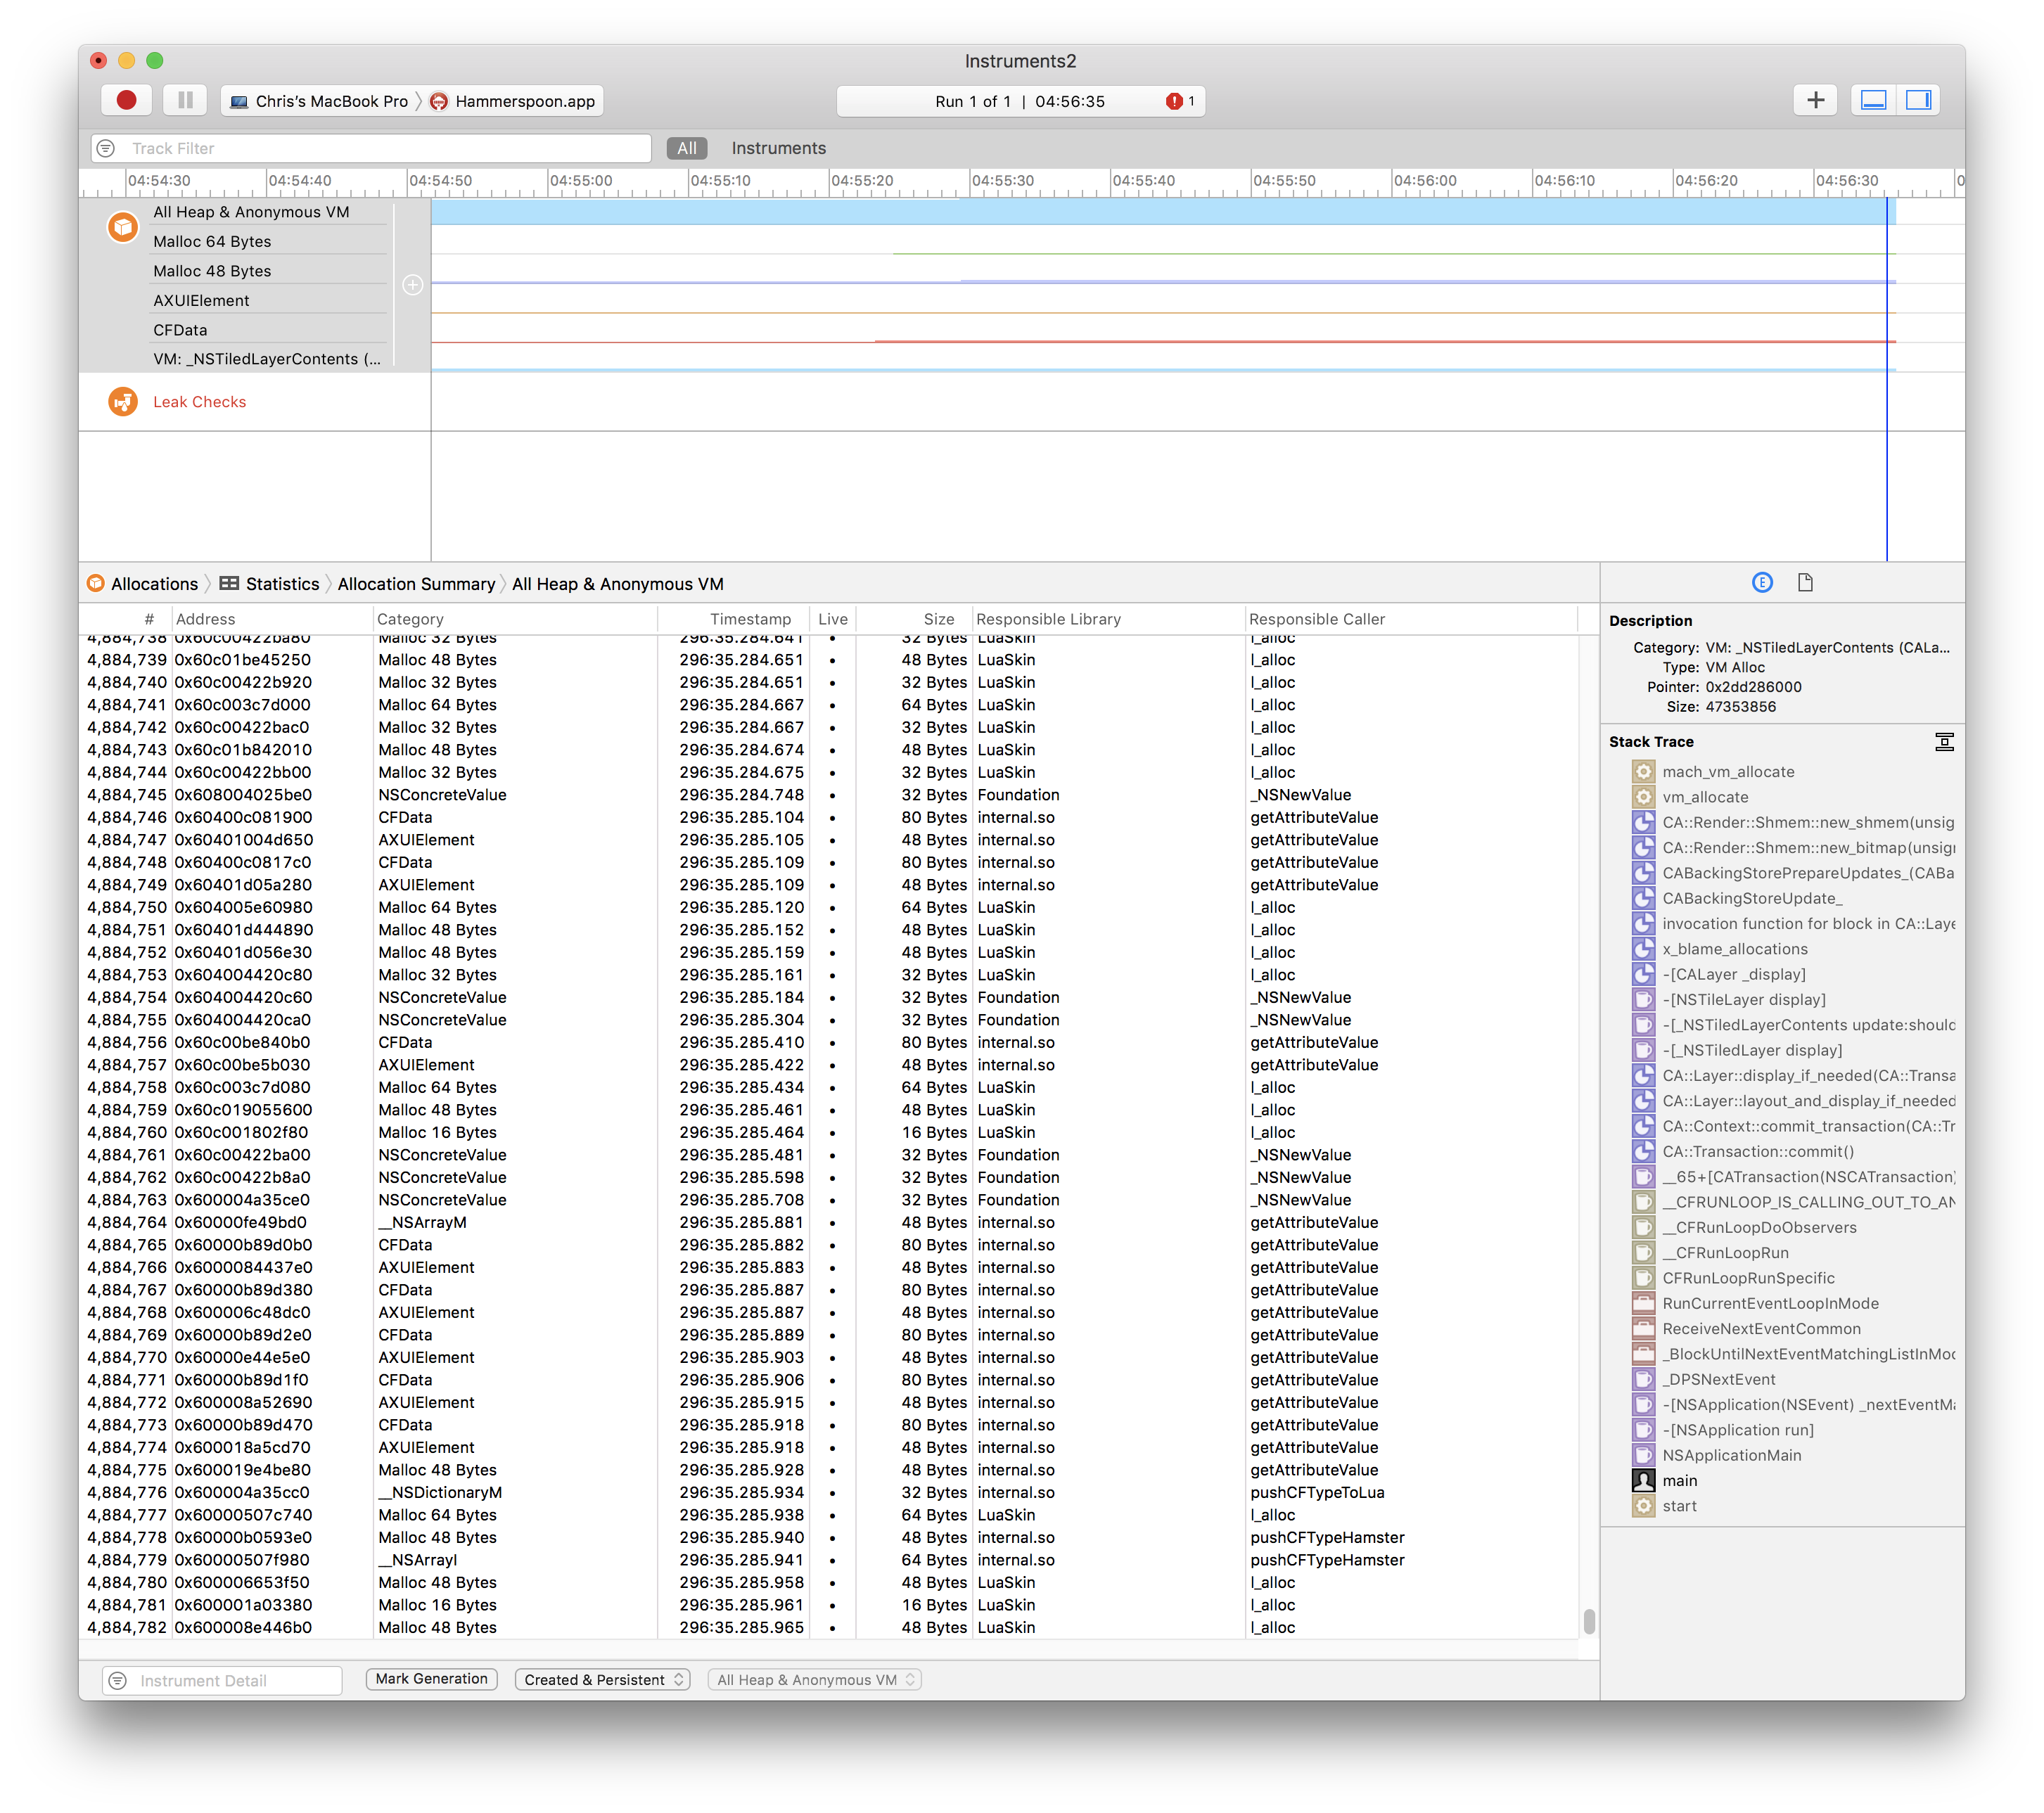
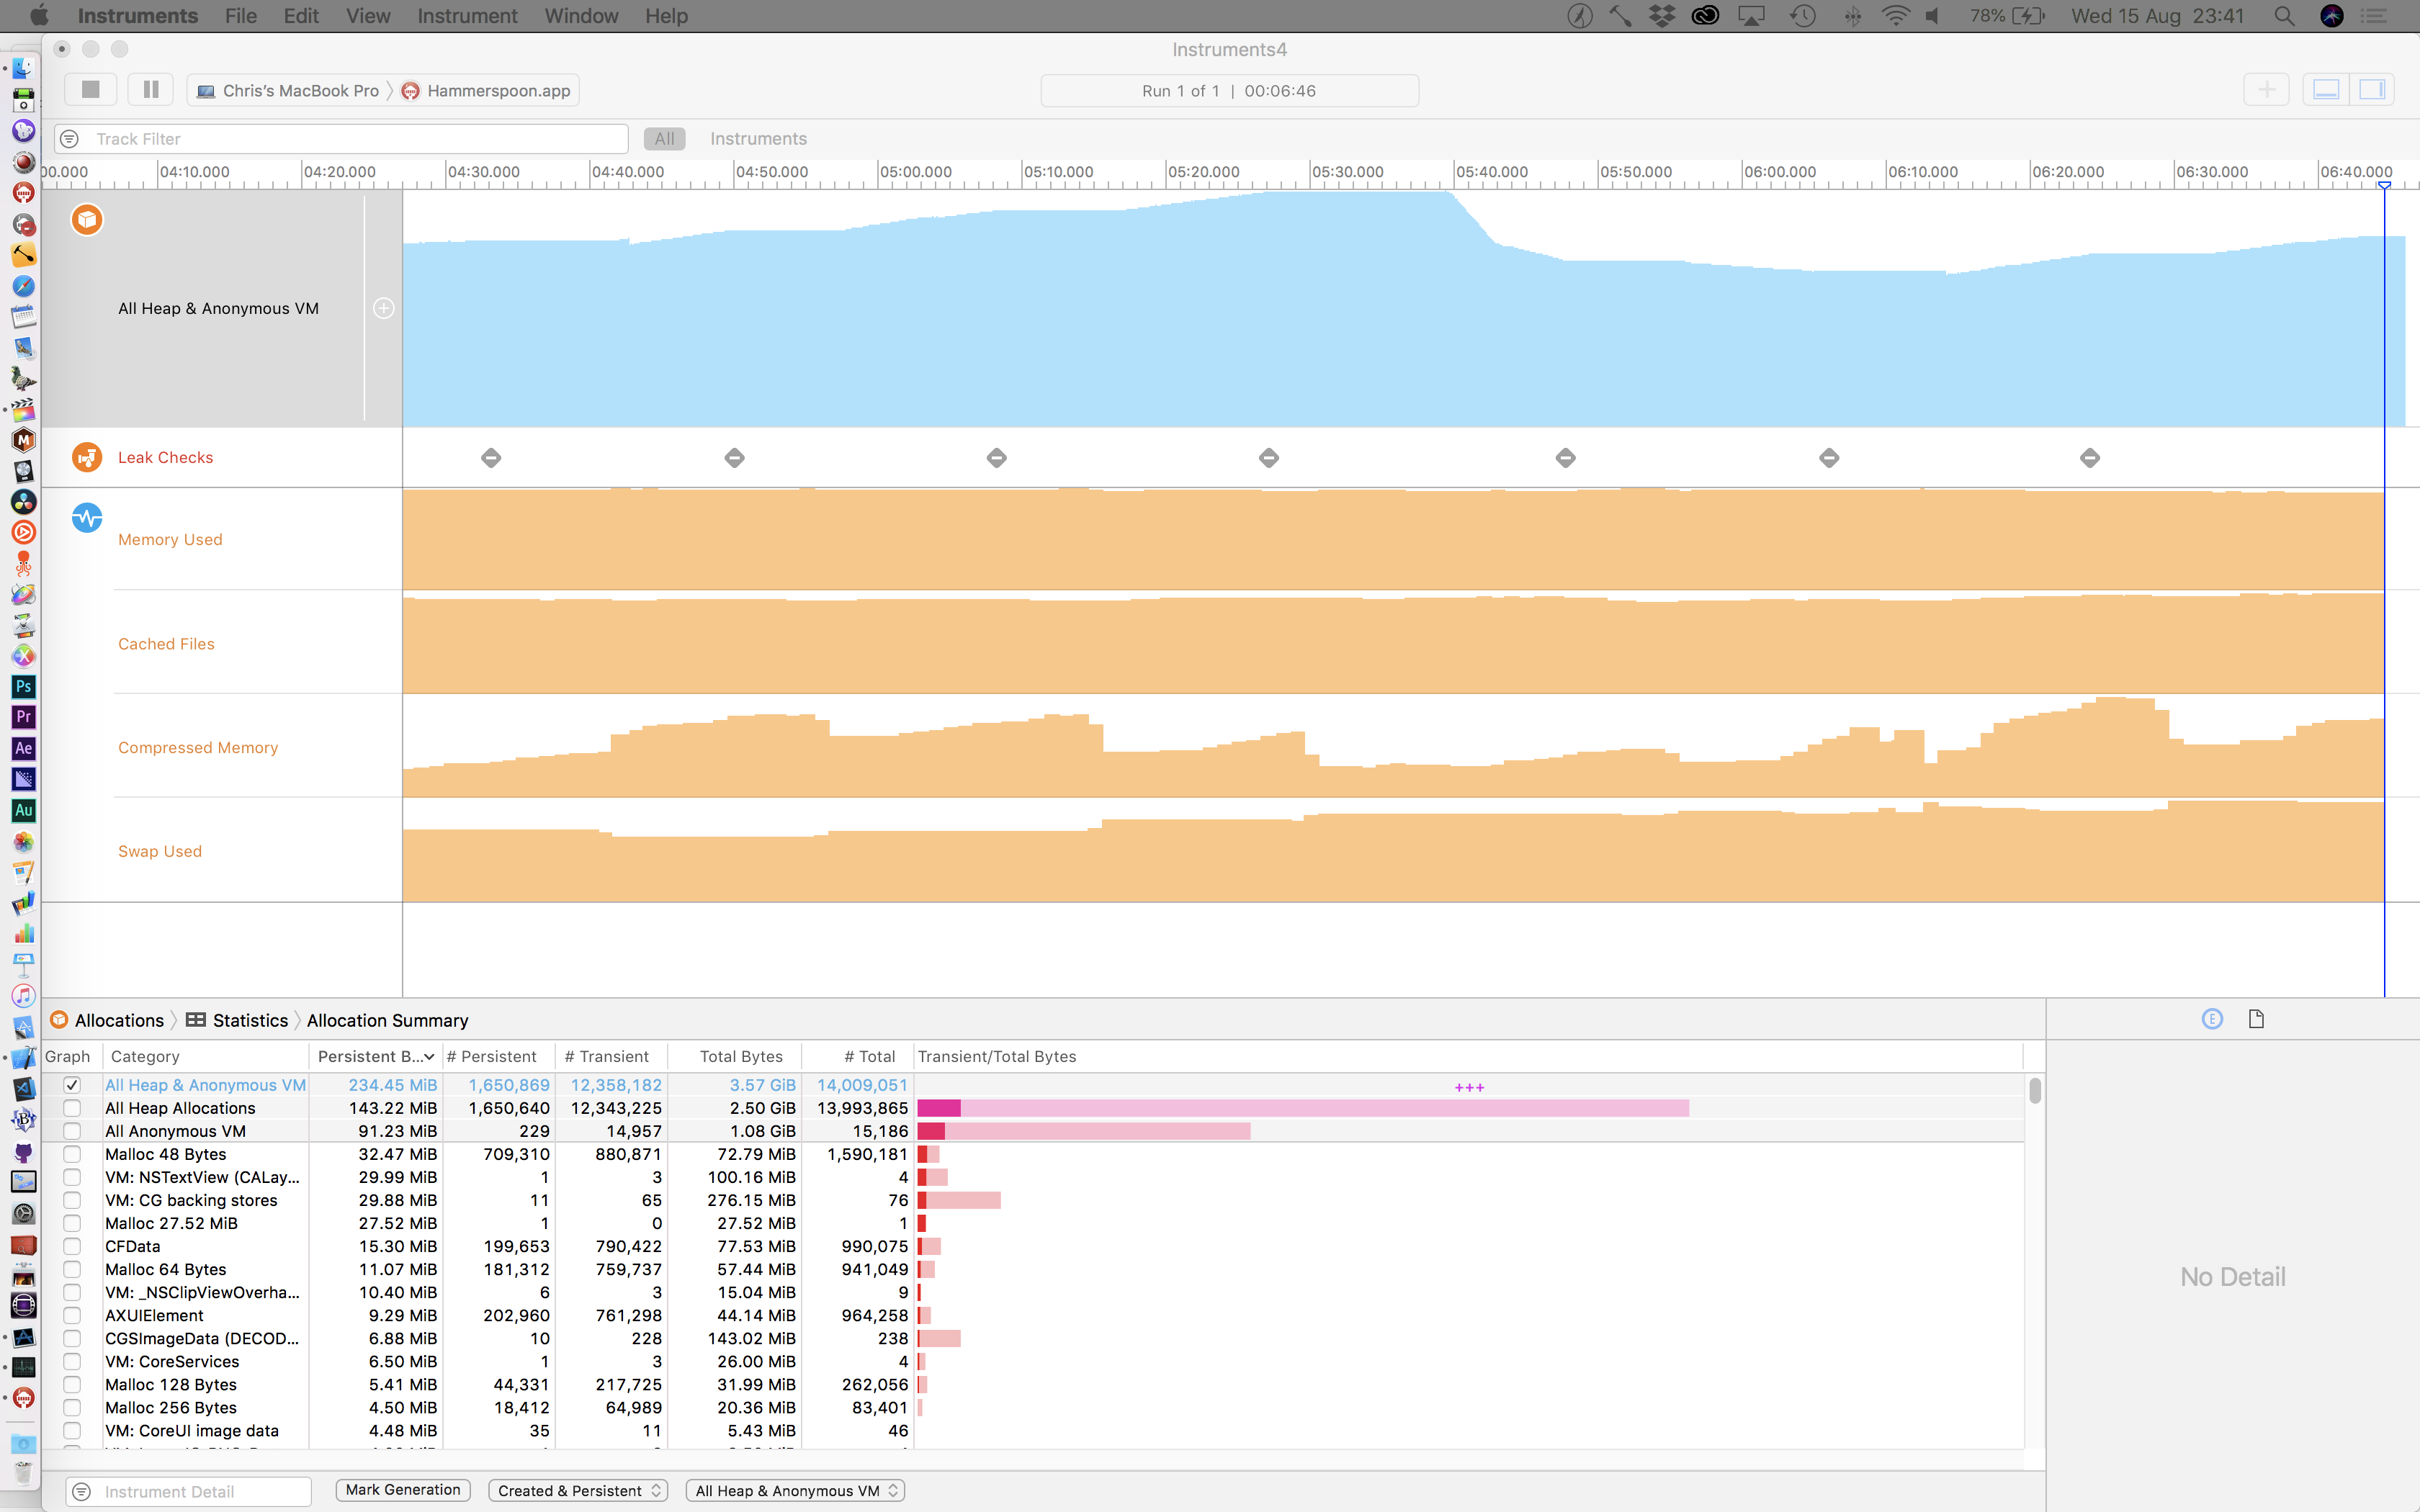
Here's what Instruments showed:
|

|
|
|
Probably not related - but FYI:
|


|
Leak from Kevin on 19th June:
|
|
Leak from Kevin on 21st June:
|


|
Leak from Kevin on 13th July:
|
|
Leak from Kevin on 13th July:
|


|
@cmsj - As suggested, I left my computer running overnight with CommandPost running via the Leaks Instrument in Xcode, and Final Cut Pro playing a timeline on loop whilst also running the following code: For this test, I also disabled the AX cache, by adjusting: The log file I was writing to the Desktop ended up as follows: At the start of the test:
At the end of the test:
|


|
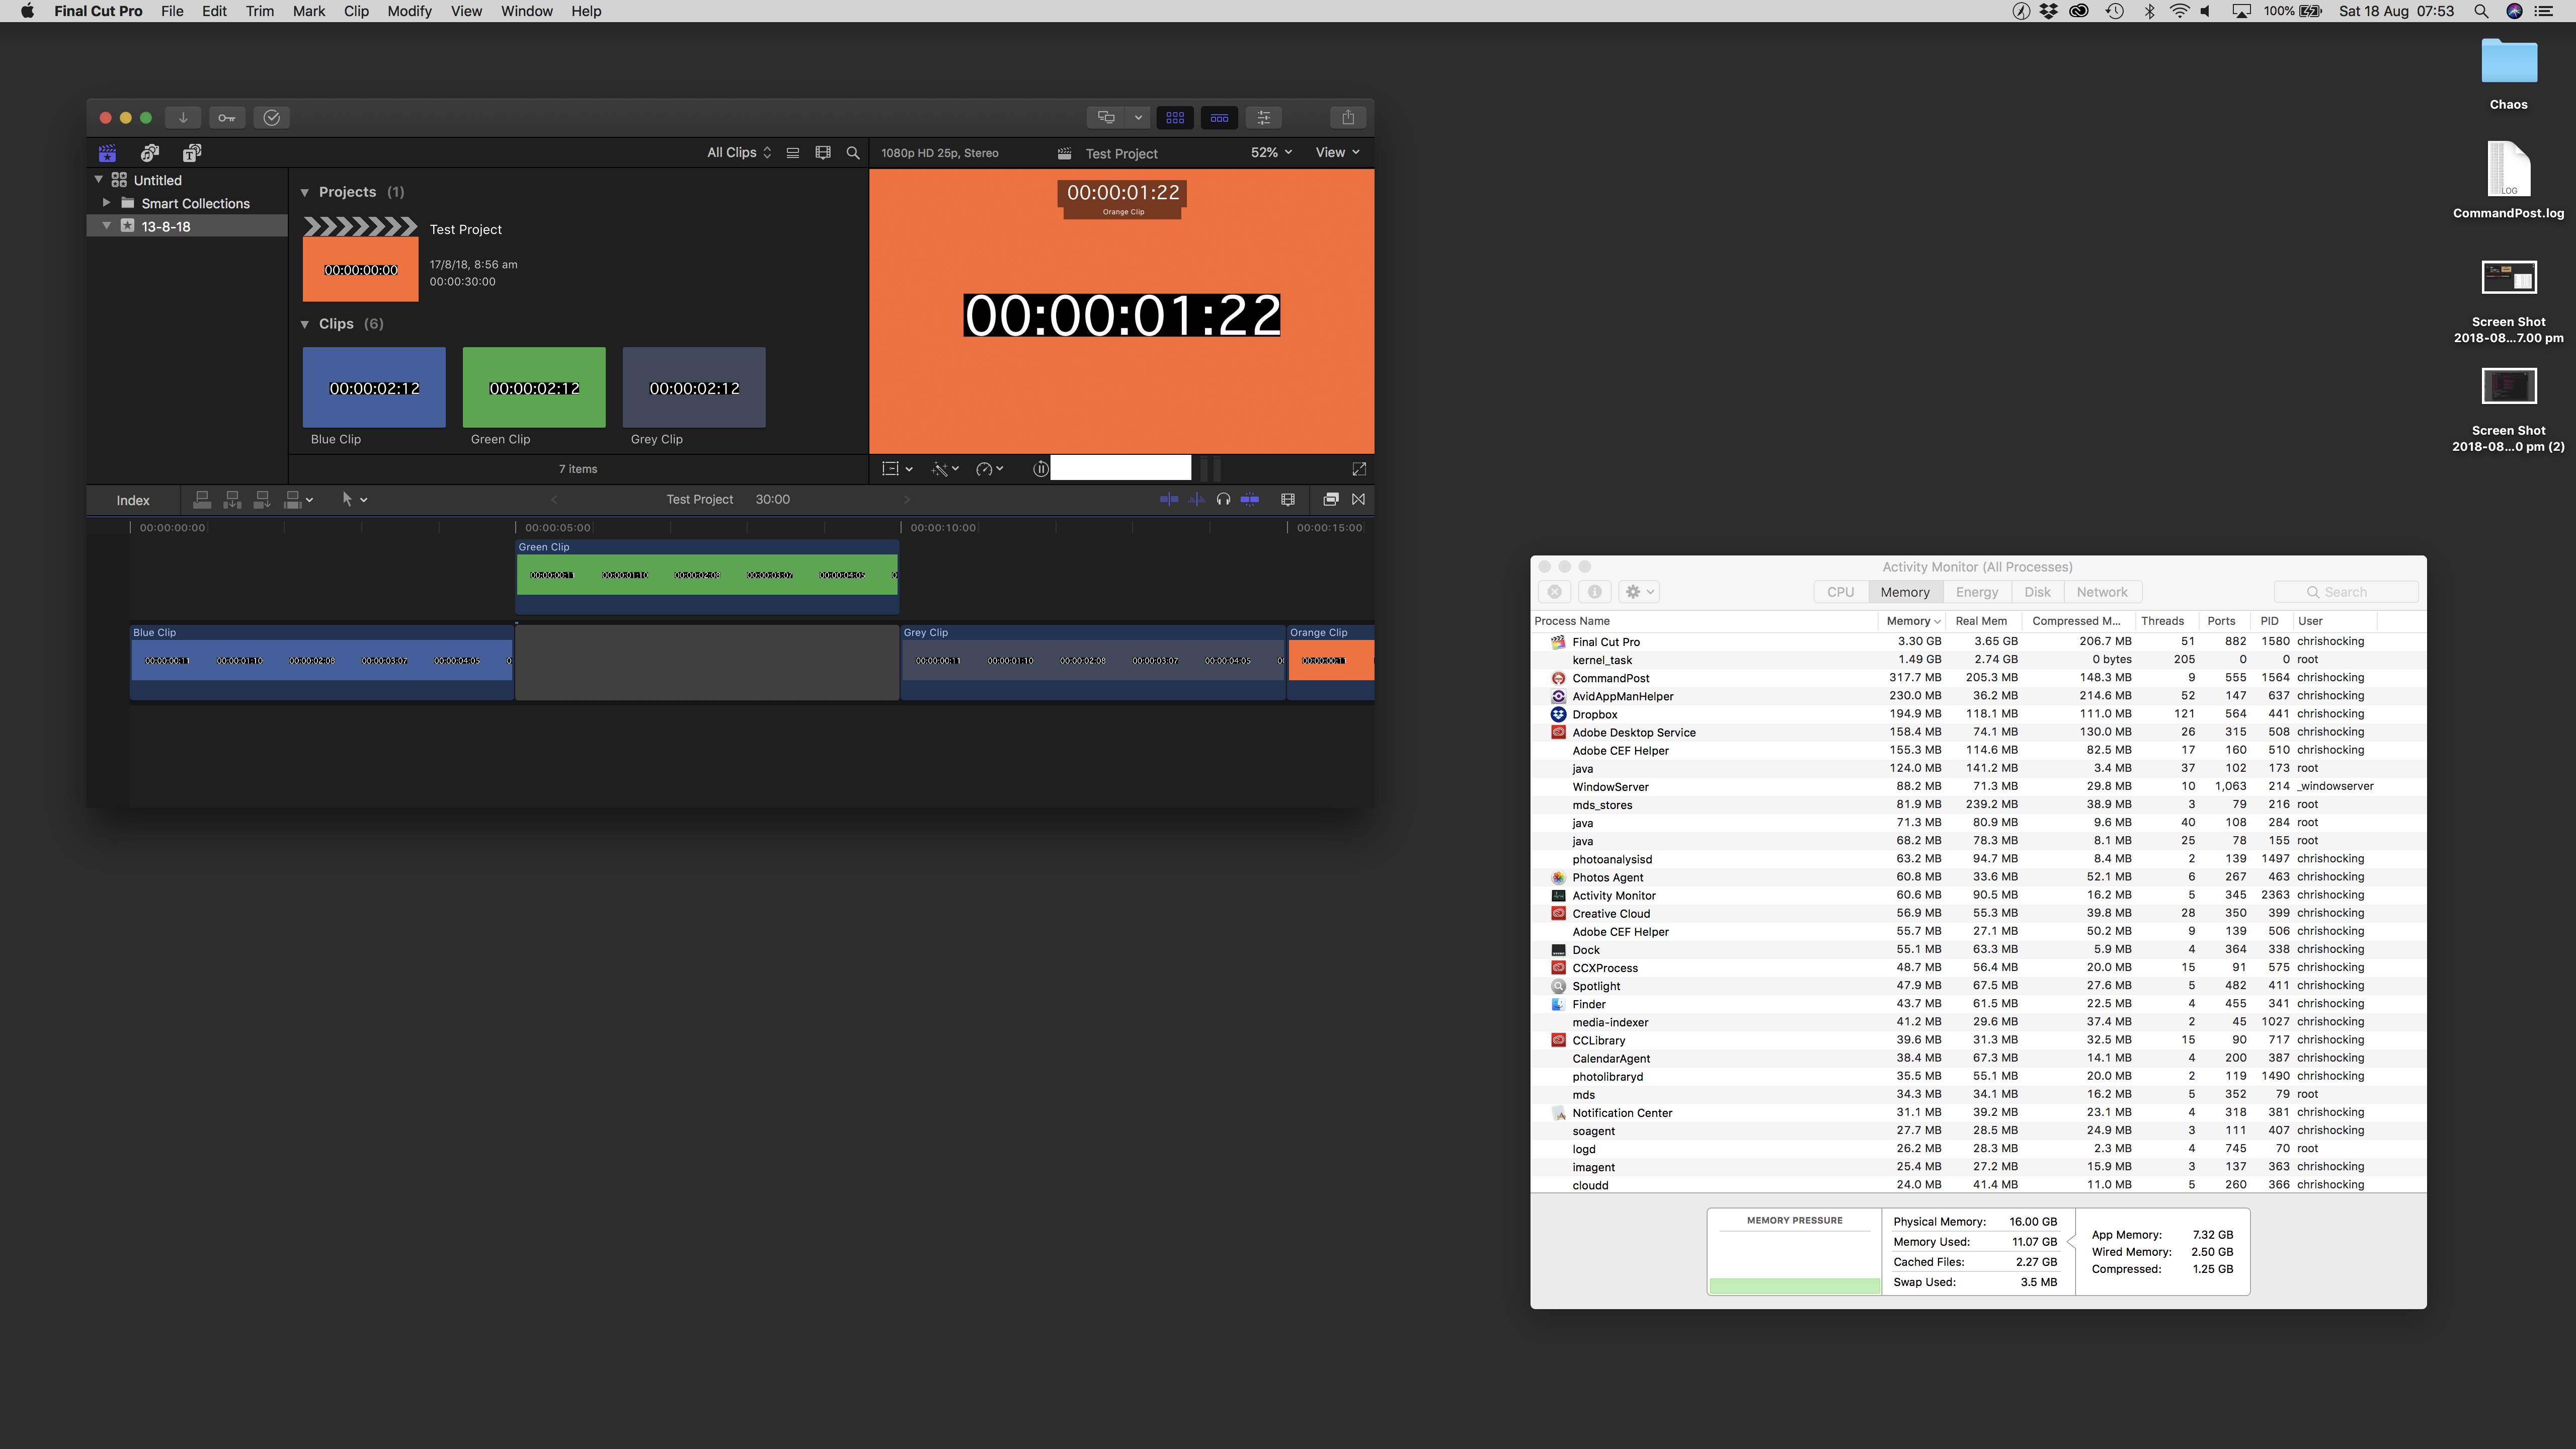
I know @randomeizer is sick of my screenshots, but here's another set. This is on one of our iMac's. All of a sudden, the Mac will popup the out of application memory error - notice the memory pressure graph and application memory value:
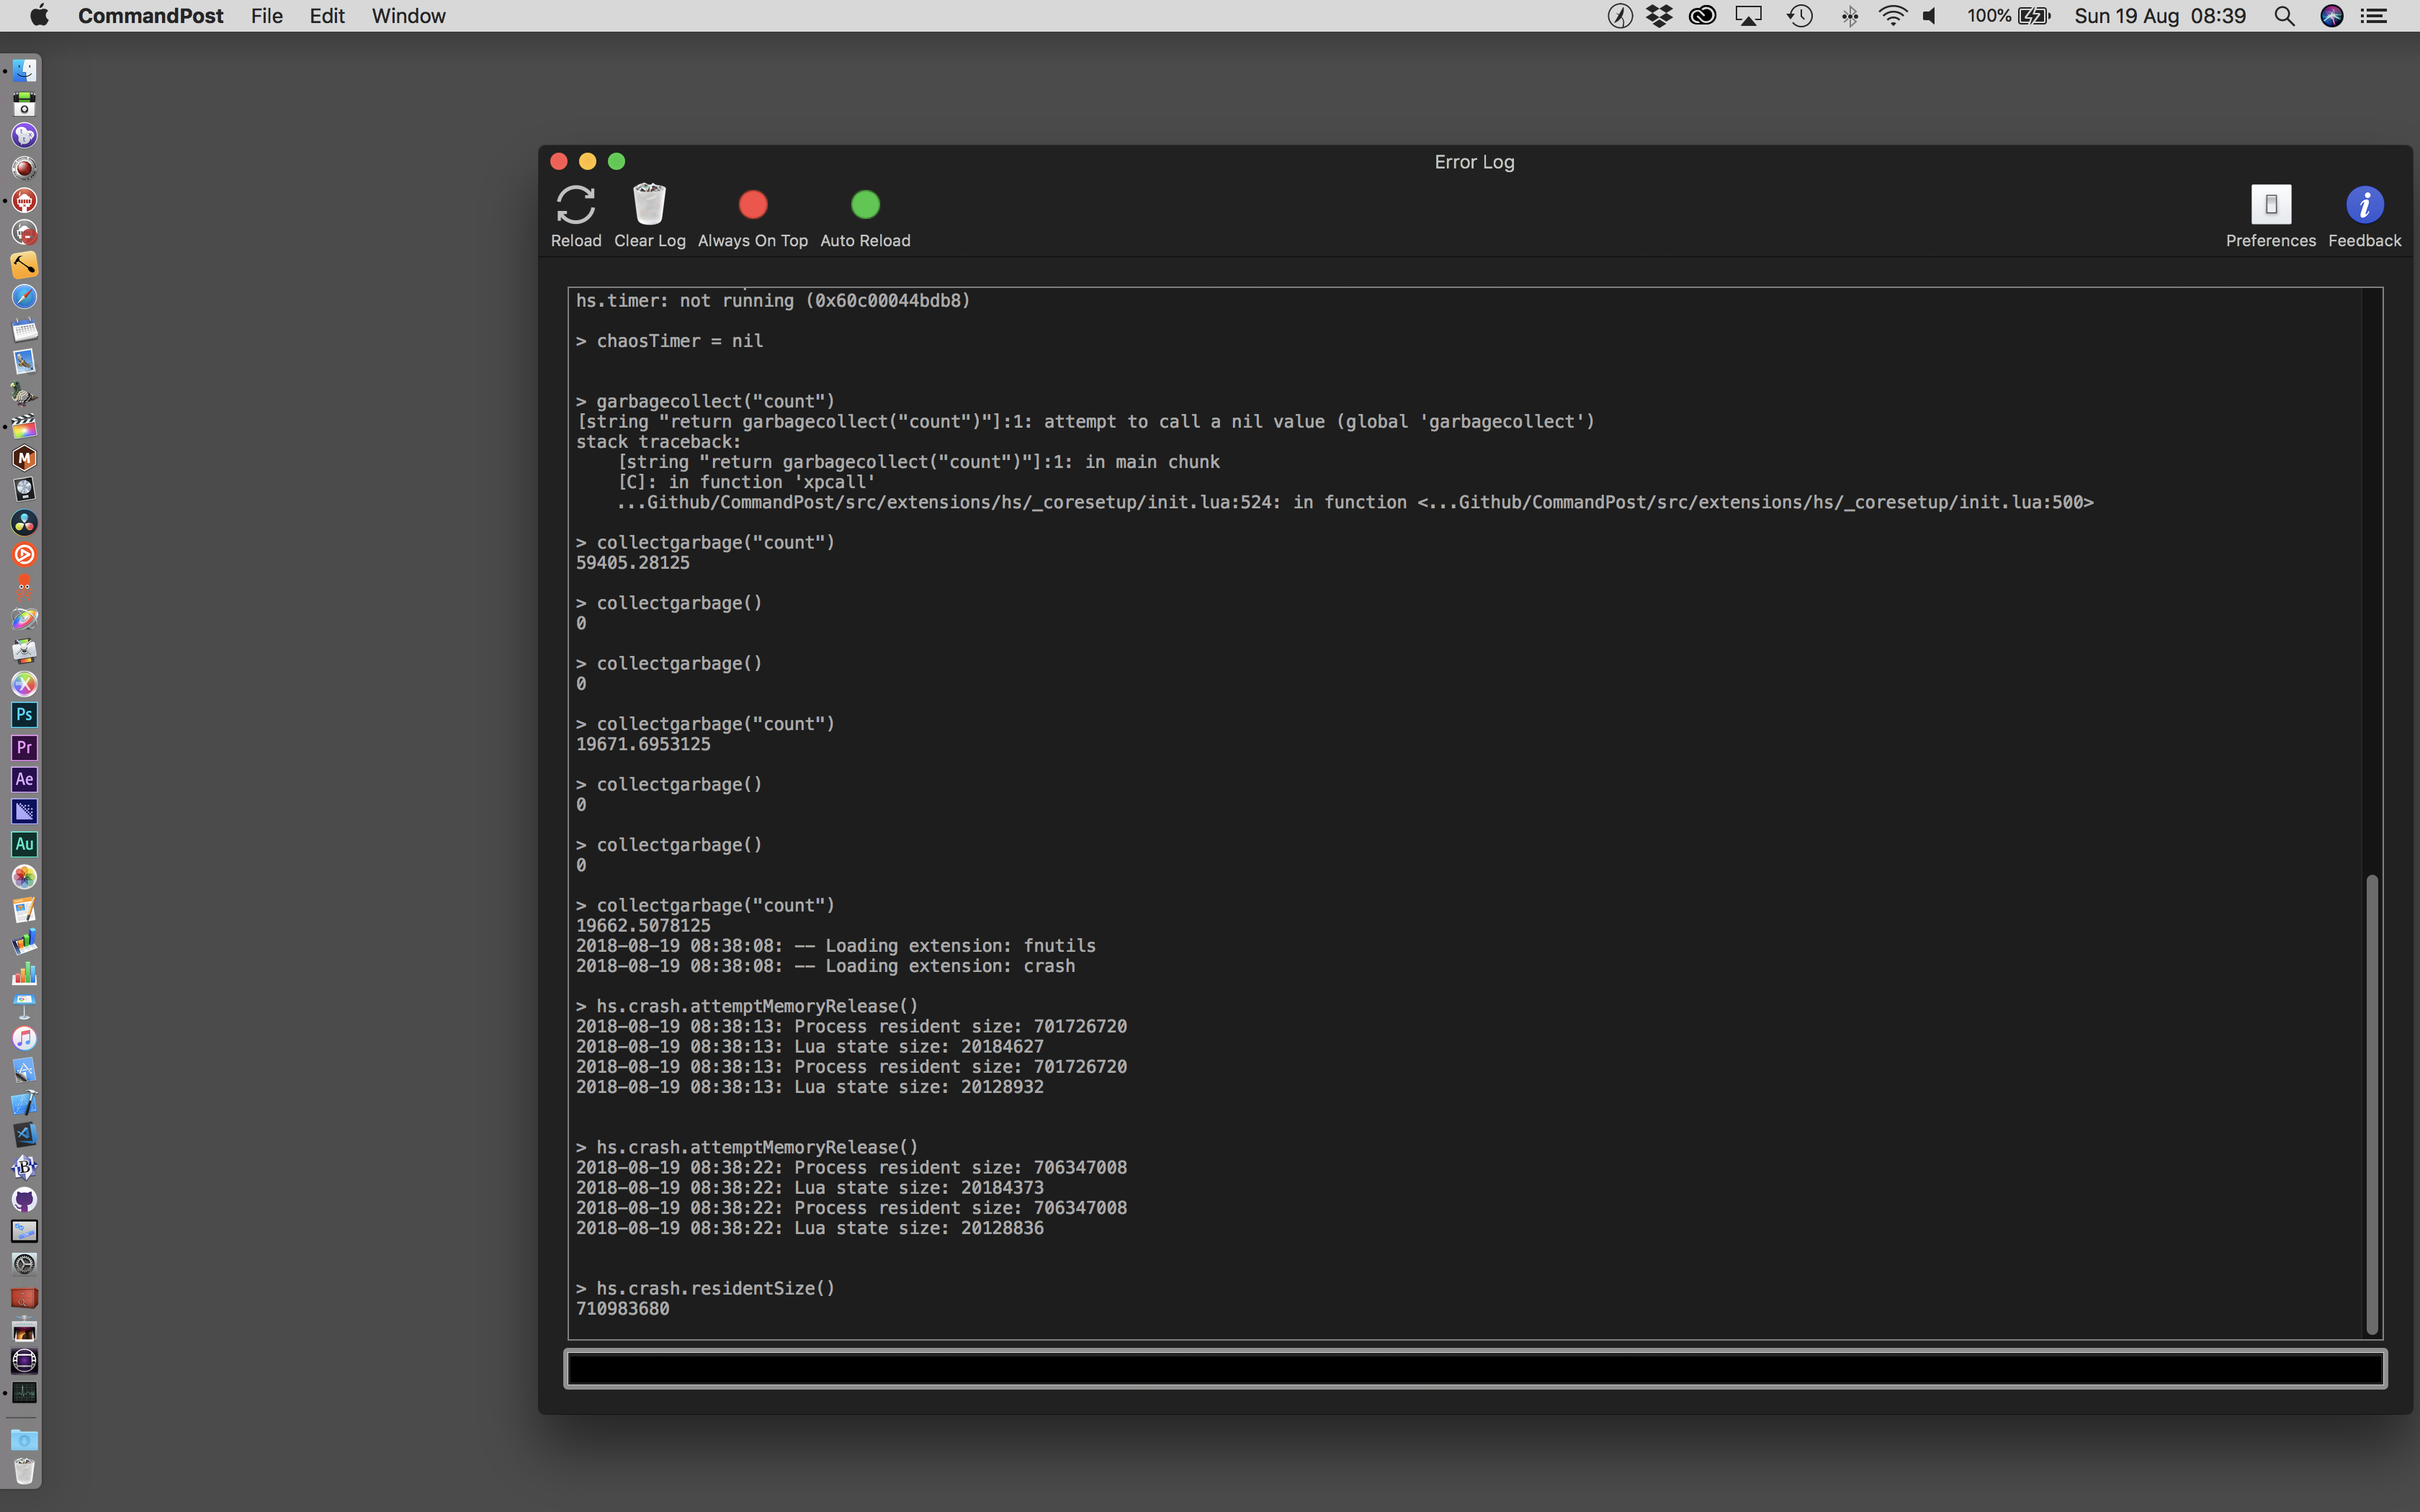
CommandPost is still accessible, so I run some garbage collection commands - it doesn't really help:
However, when I gracefully quit CommandPost, everything goes back to normal:
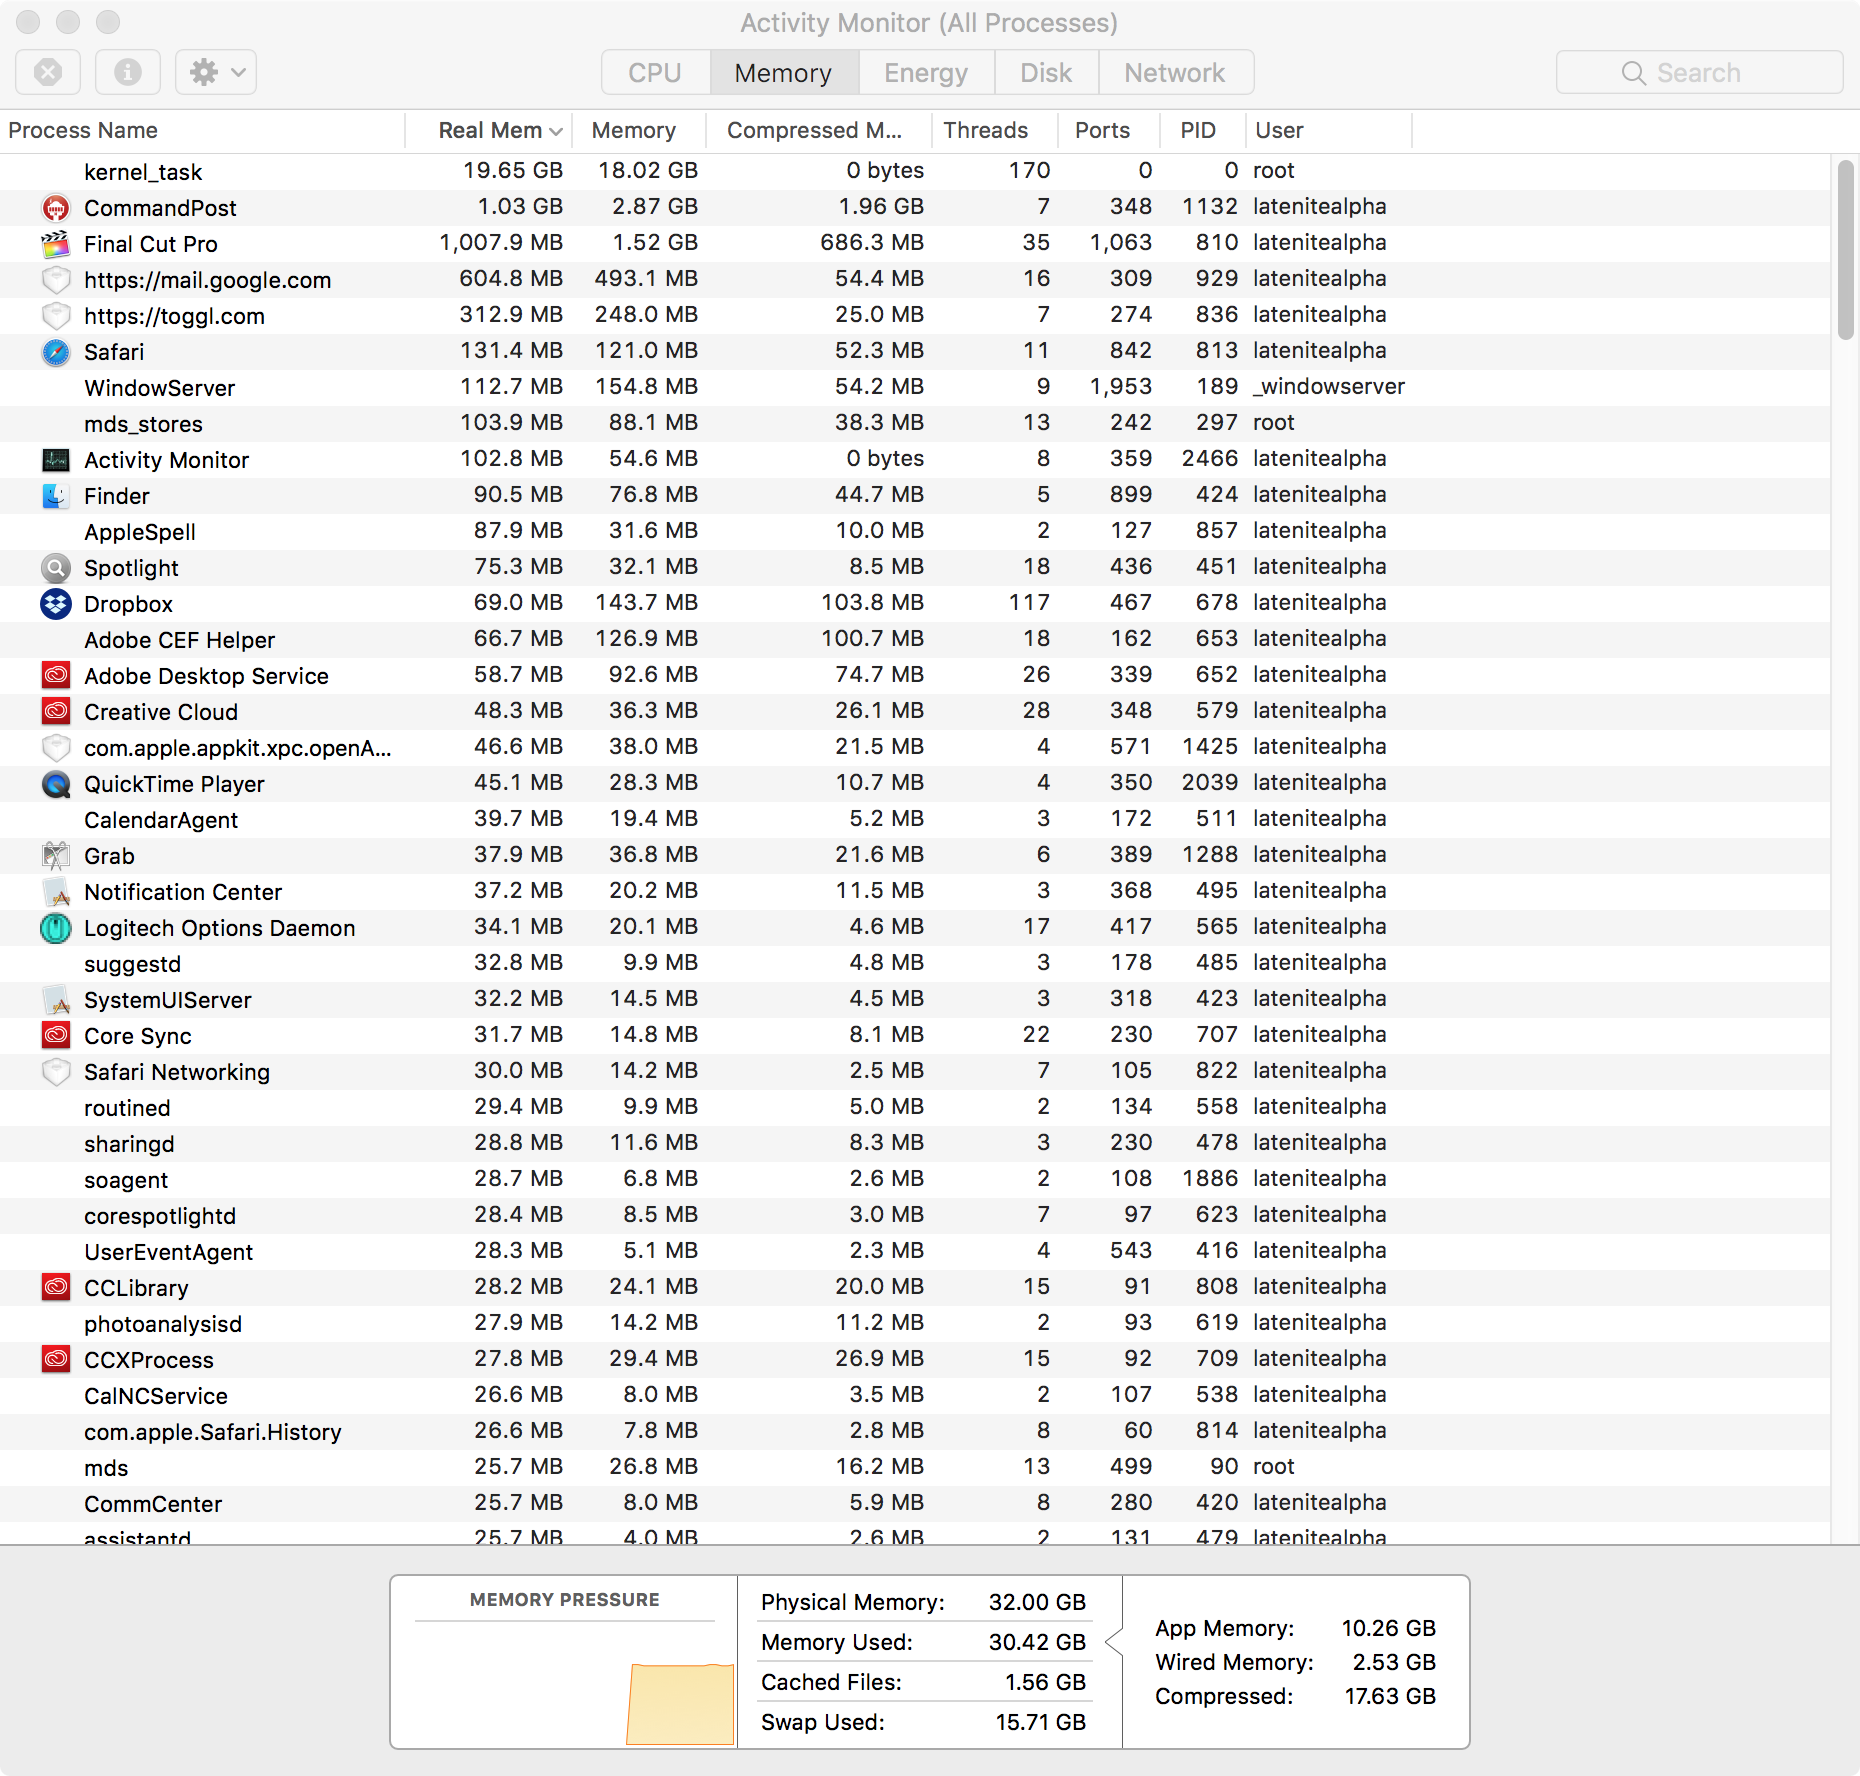
It seems like "kernel_task" is the biggest memory hog - but I'm not sure why or how it's connected. Before & After:
|


|
Note to self - another test. This time just running CommandPost normally - without Xcode Instruments. Before:
During:
After:
Garbage Collection Count values: |


|
An earlier test... Before:
During:
First Sign of Trouble:
Just before CommandPost quit:
|


|
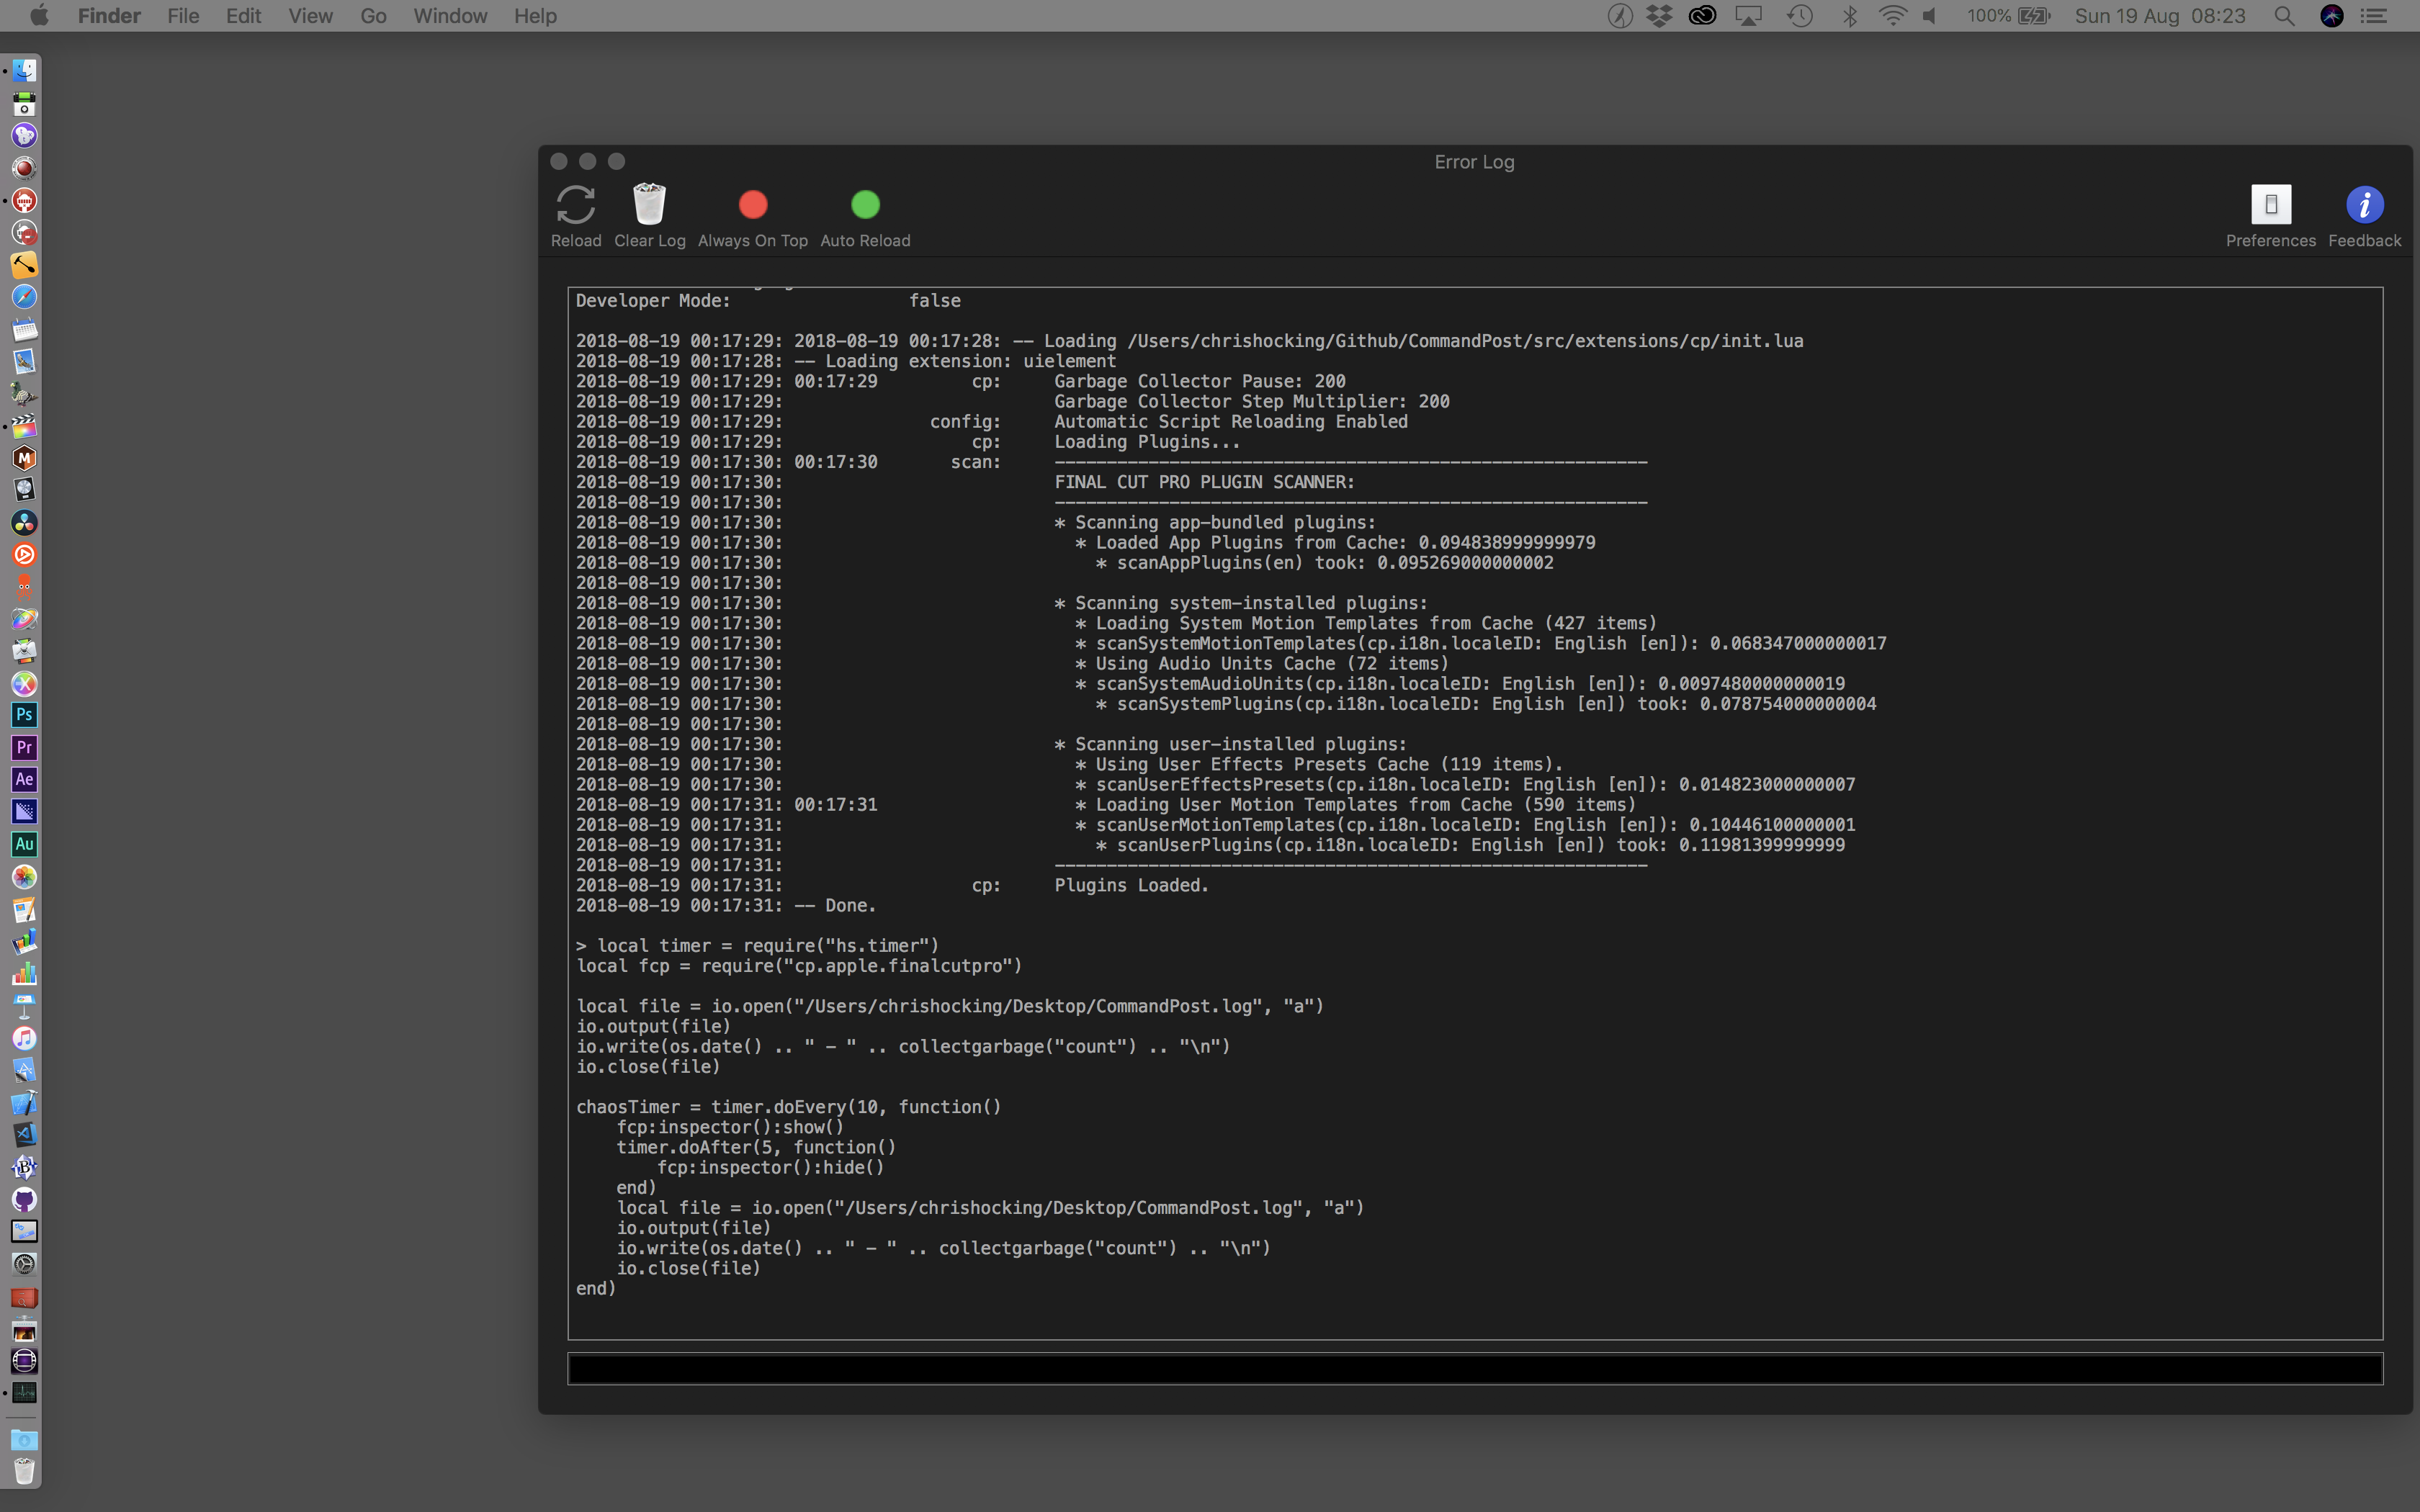
For comparison, I just left Beta 29 running all night. Unfortunately a few hours after I started it weirdly got a Lua error, which broke my test > local timer = require("hs.timer")
local fcp = require("cp.apple.finalcutpro")
local file = io.open("/Users/chrishocking/Desktop/CommandPost.log", "a")
io.output(file)
io.write(os.date() .. " - " .. collectgarbage("count") .. "\n")
io.close(file)
chaosTimer = timer.doEvery(10, function()
fcp:inspector():show()
timer.doAfter(5, function()
fcp:inspector():hide()
end)
local file = io.open("/Users/chrishocking/Desktop/CommandPost.log", "a")
io.output(file)
io.write(os.date() .. " - " .. collectgarbage("count") .. "\n")
io.close(file)
end)
2018-08-18 01:10:56: ********
2018-08-18 01:10:56: 01:10:56 ERROR: LuaSkin: hs.timer callback error: .../extensions/cp/apple/finalcutpro/inspector/Inspector.lua:283: attempt to index a boolean value
stack traceback:
.../extensions/cp/apple/finalcutpro/inspector/Inspector.lua:283: in function 'cp.apple.finalcutpro.inspector.Inspector.show'
[string "local timer = require("hs.timer")..."]:10: in function <[string "local timer = require("hs.timer")..."]:9>
2018-08-18 01:10:56: ********FYI: This bug has already been fixed in Beta 30. However, that aside, it still ran all night without any "Out of application memory" errors by the morning. Before:
After:
Here's the garbage collection test results prior to the timer failing: https://gist.github.com/latenitefilms/37336803ea99ec6b9883f39ef083162d |
|
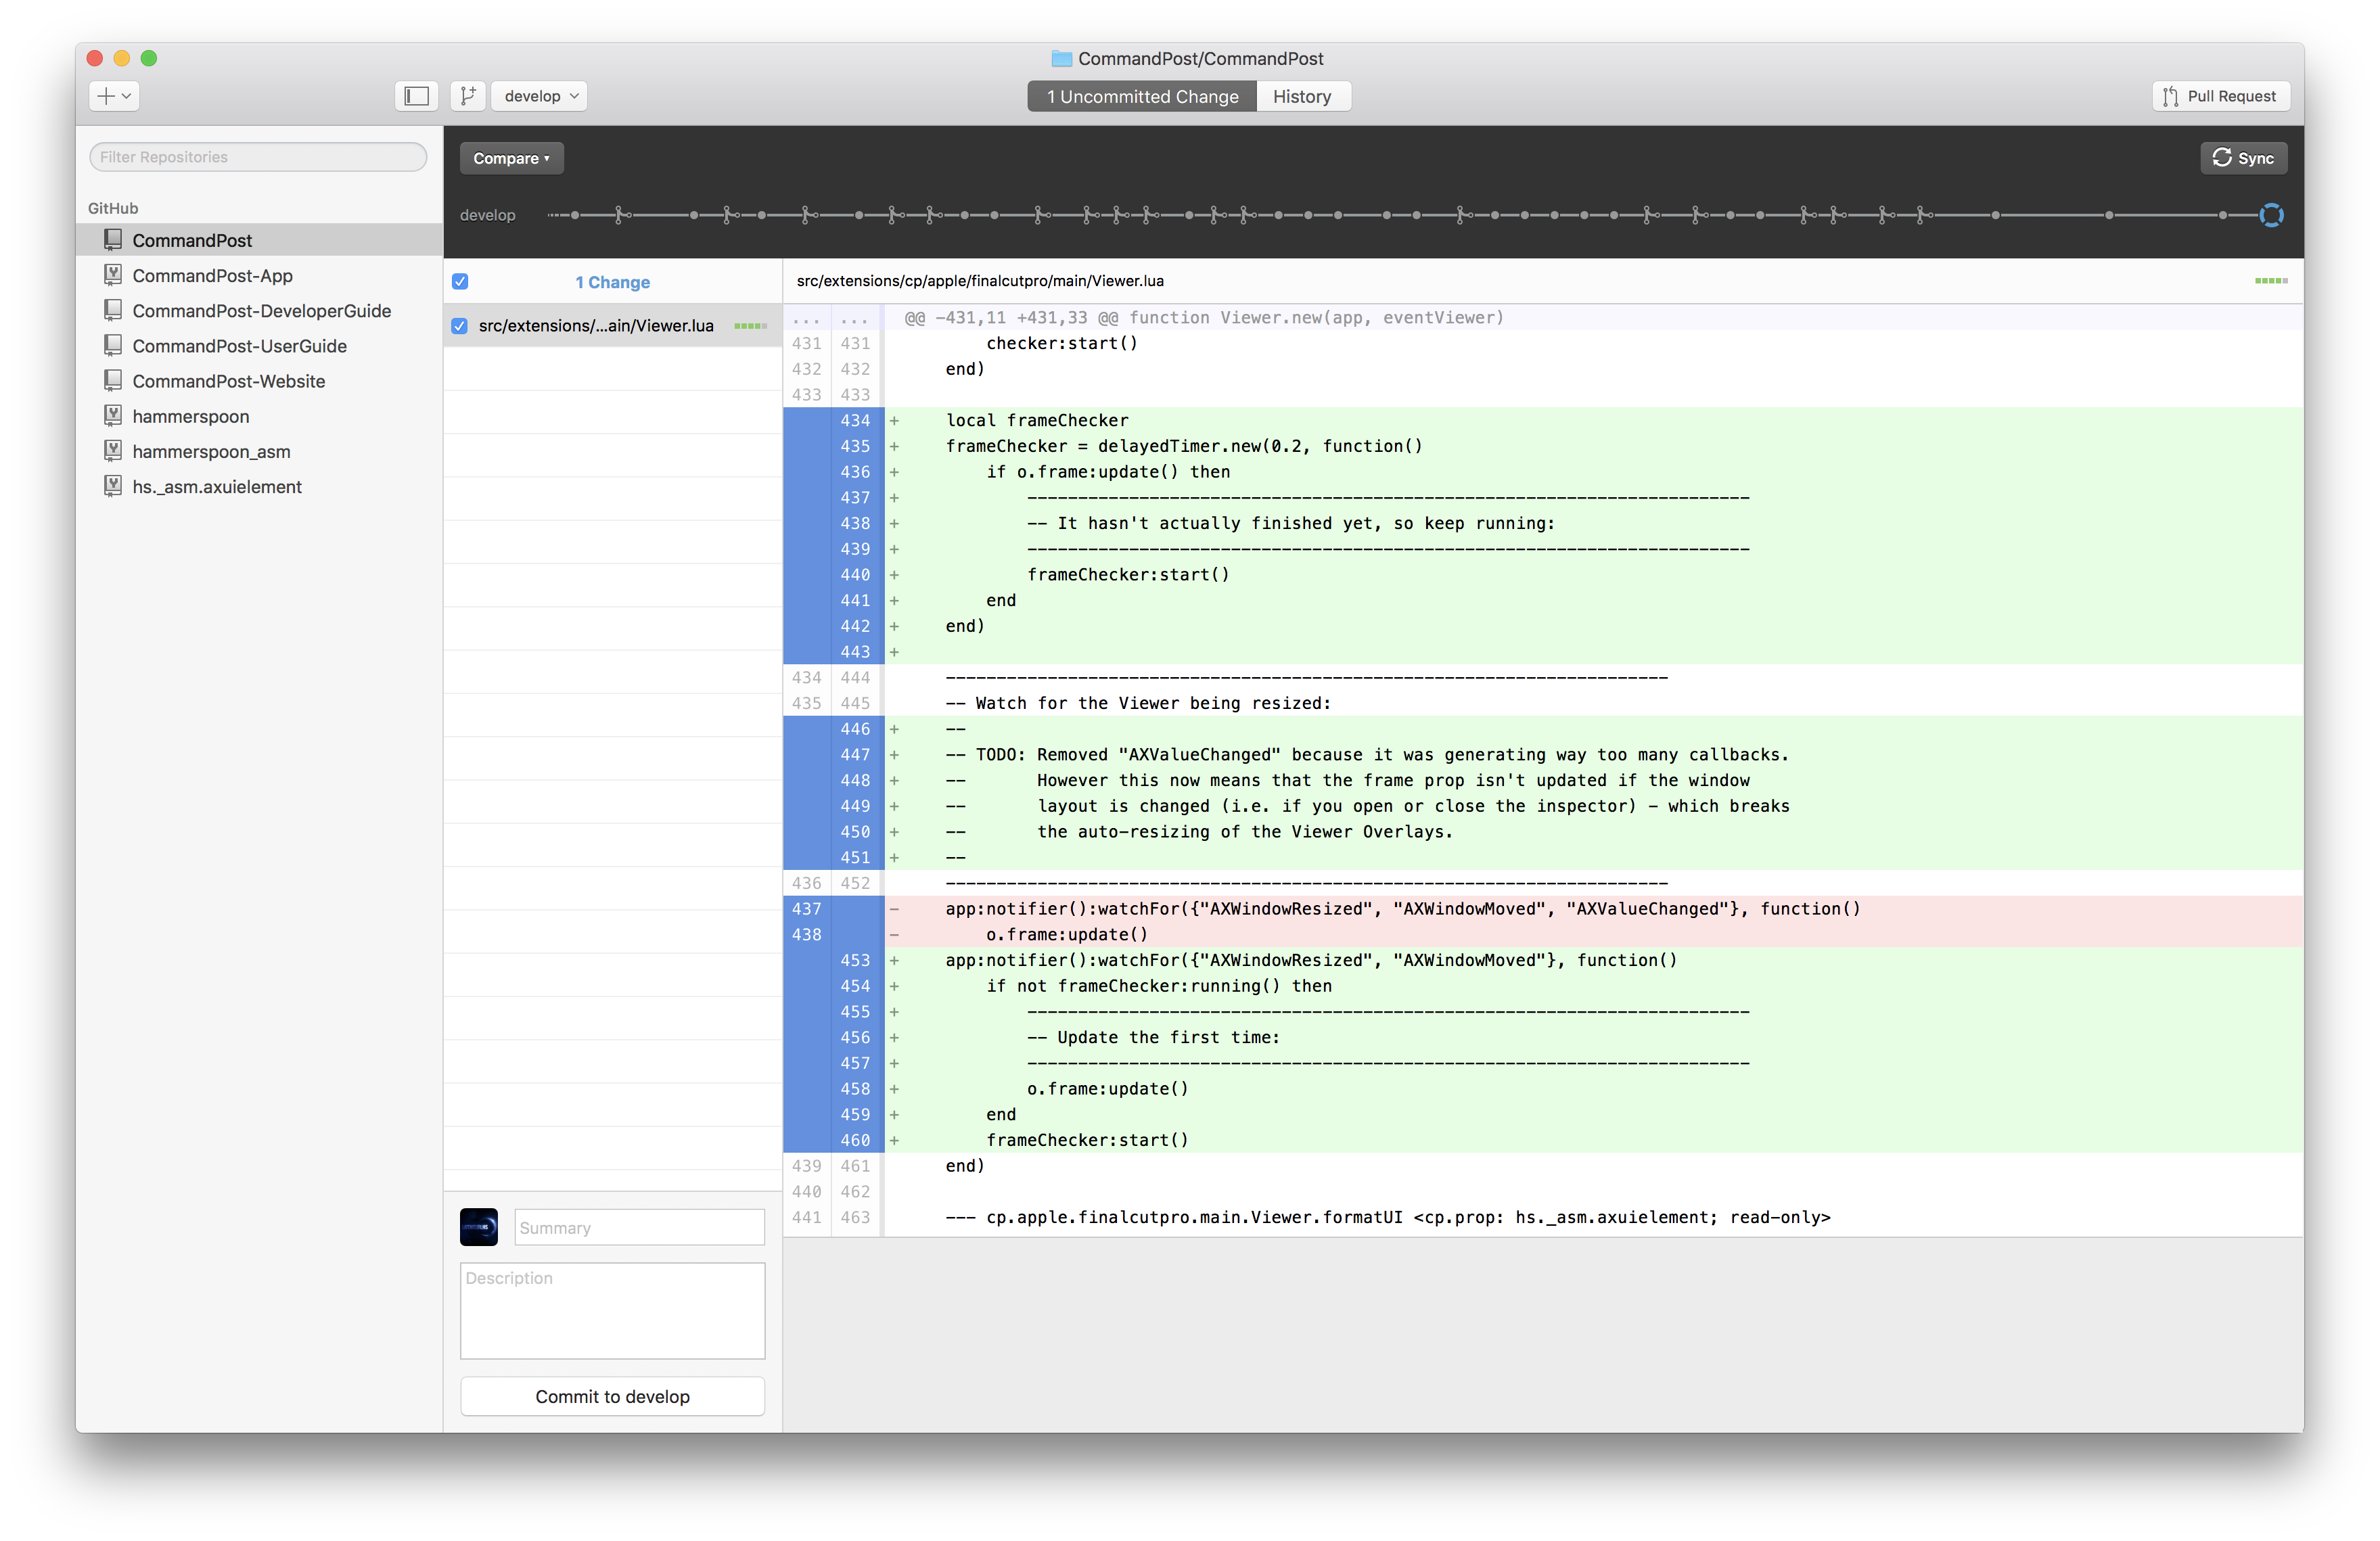
Ok, so I had a minor victory last night. I made the following minor change to latest
With the CommandPost Grid Viewer Overlay enabled, Scrolling Timeline enabled, and Final Cut Pro playing, I then executed the following test code: local timer = require("hs.timer")
local fcp = require("cp.apple.finalcutpro")
local file = io.open("/Users/chrishocking/Desktop/CommandPost.log", "a")
io.output(file)
io.write(os.date() .. " - " .. collectgarbage("count") .. "\n")
io.close(file)
chaosTimer = timer.doEvery(10, function()
fcp:inspector():show()
timer.doAfter(5, function()
fcp:inspector():hide()
end)
local file = io.open("/Users/chrishocking/Desktop/CommandPost.log", "a")
io.output(file)
io.write(os.date() .. " - " .. collectgarbage("count") .. "\n")
io.close(file)
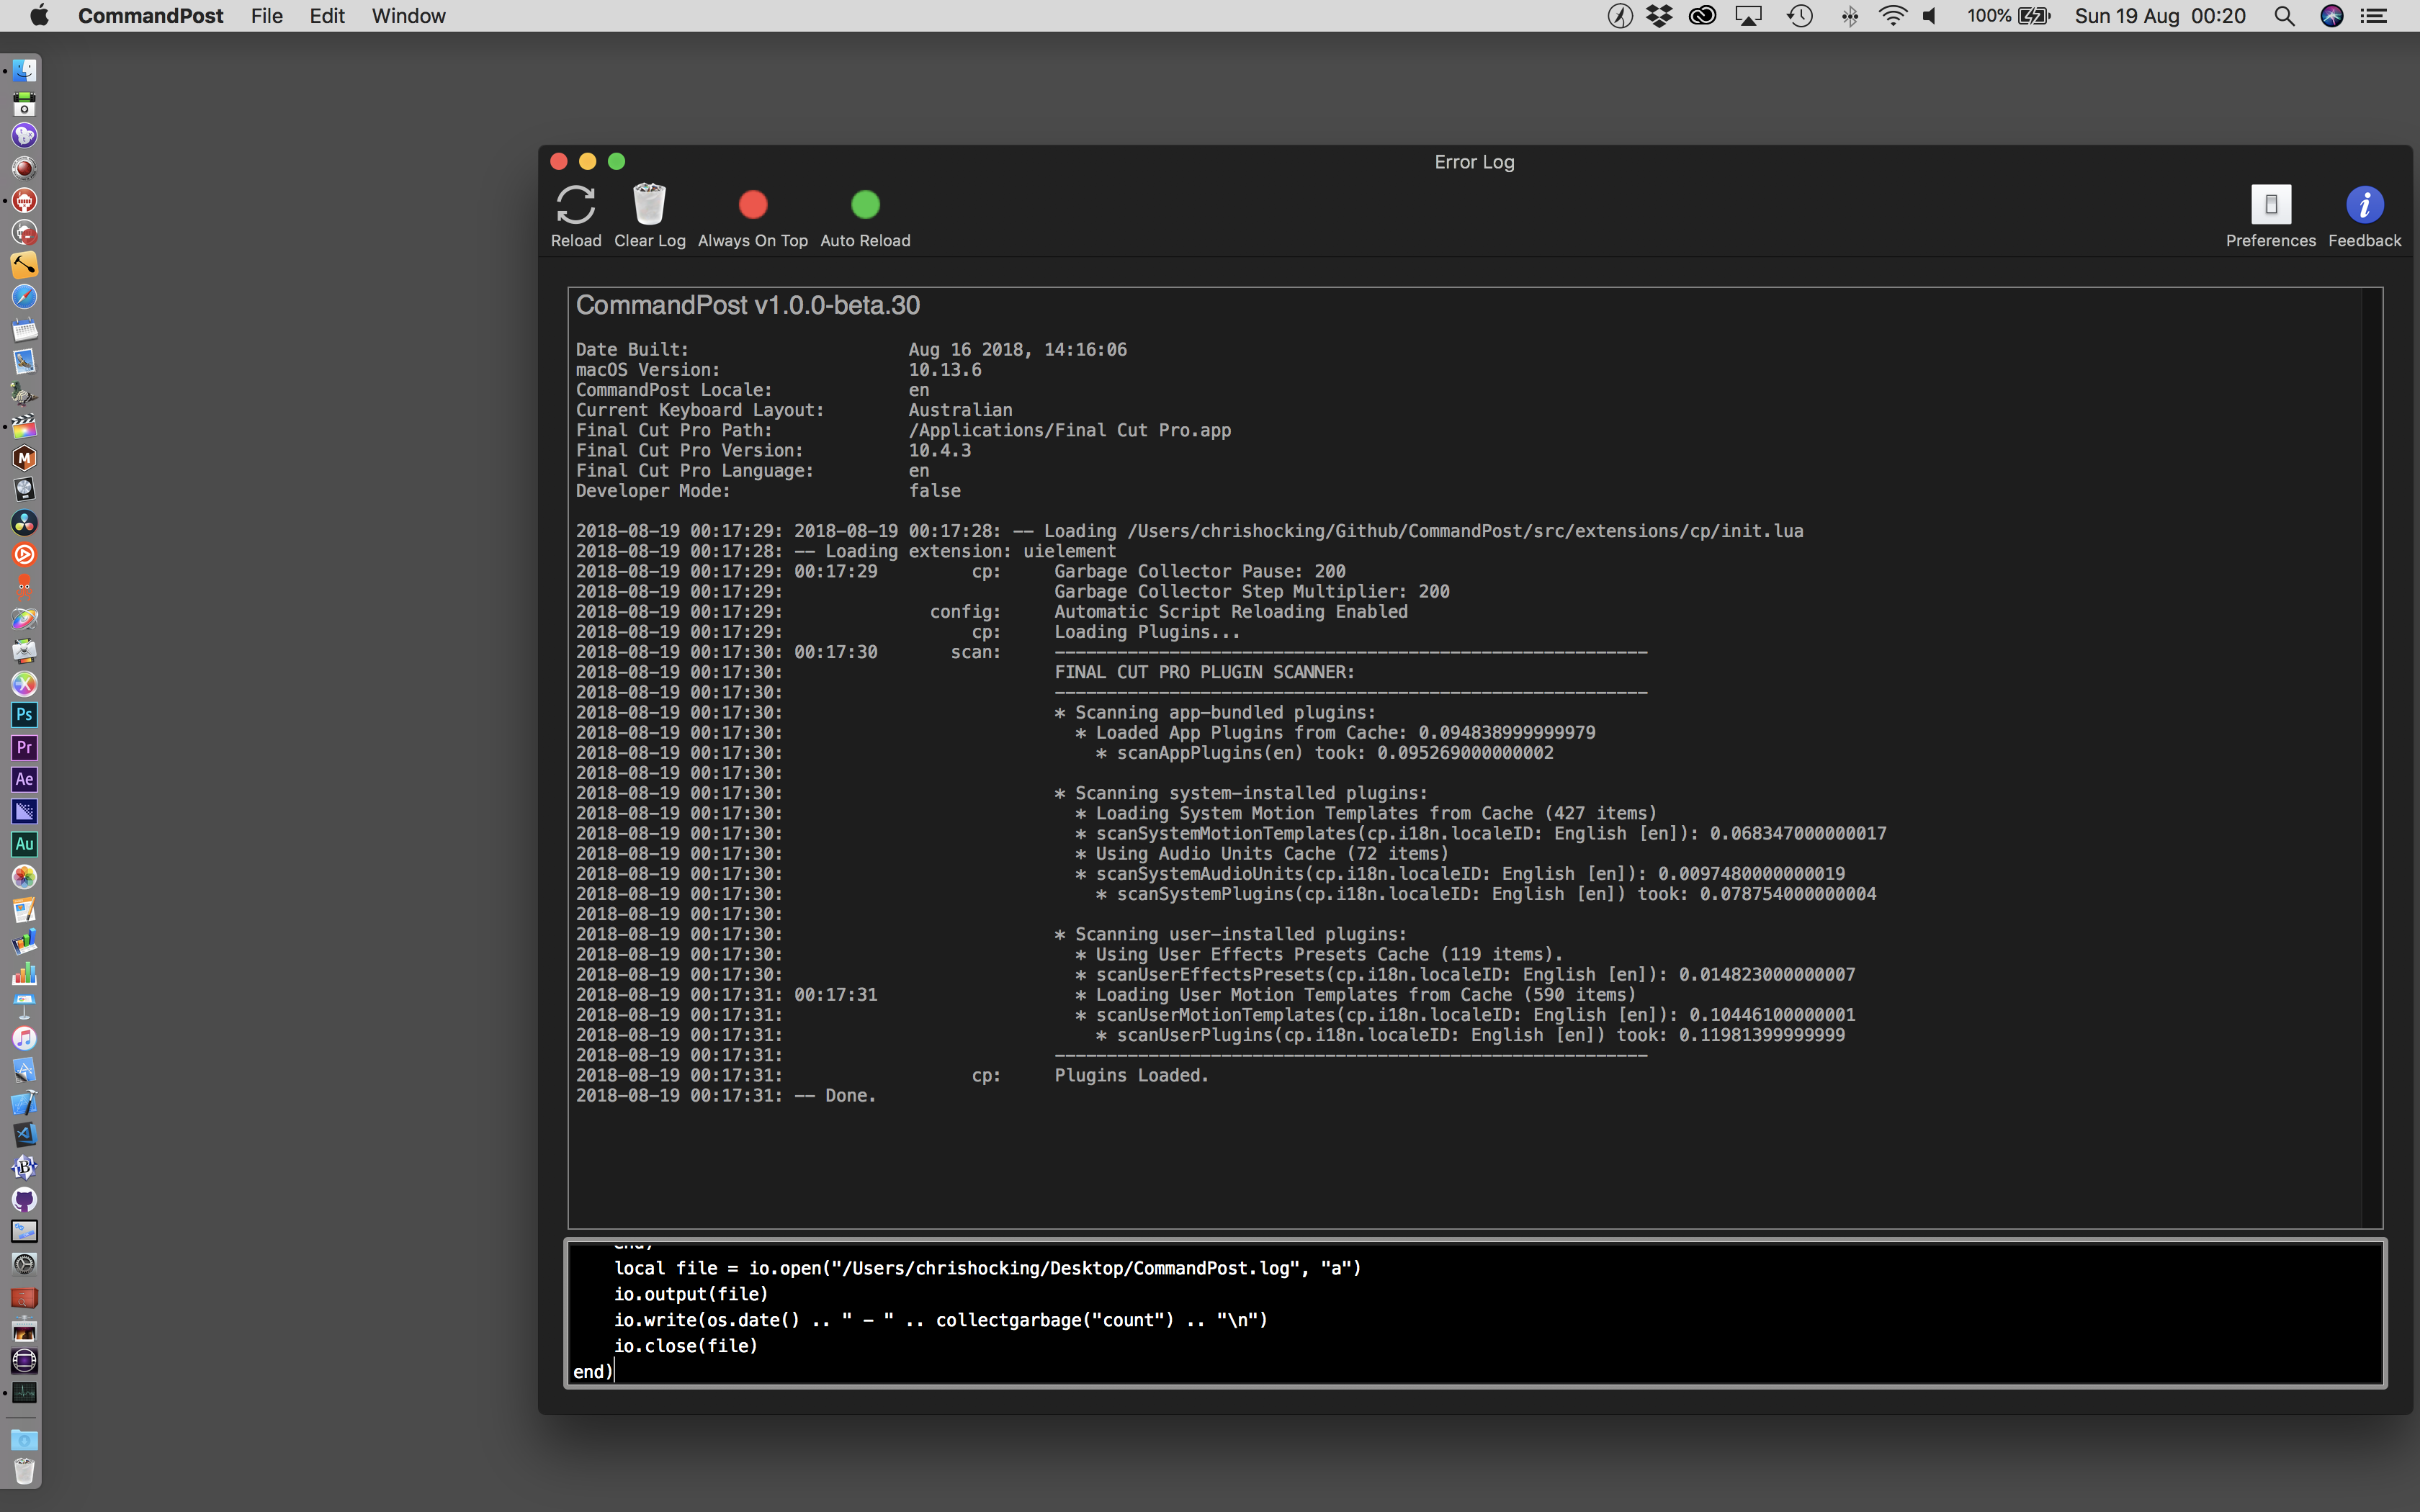
end)Here's the output of the log file: Here's what everything looked like before I executed that code:
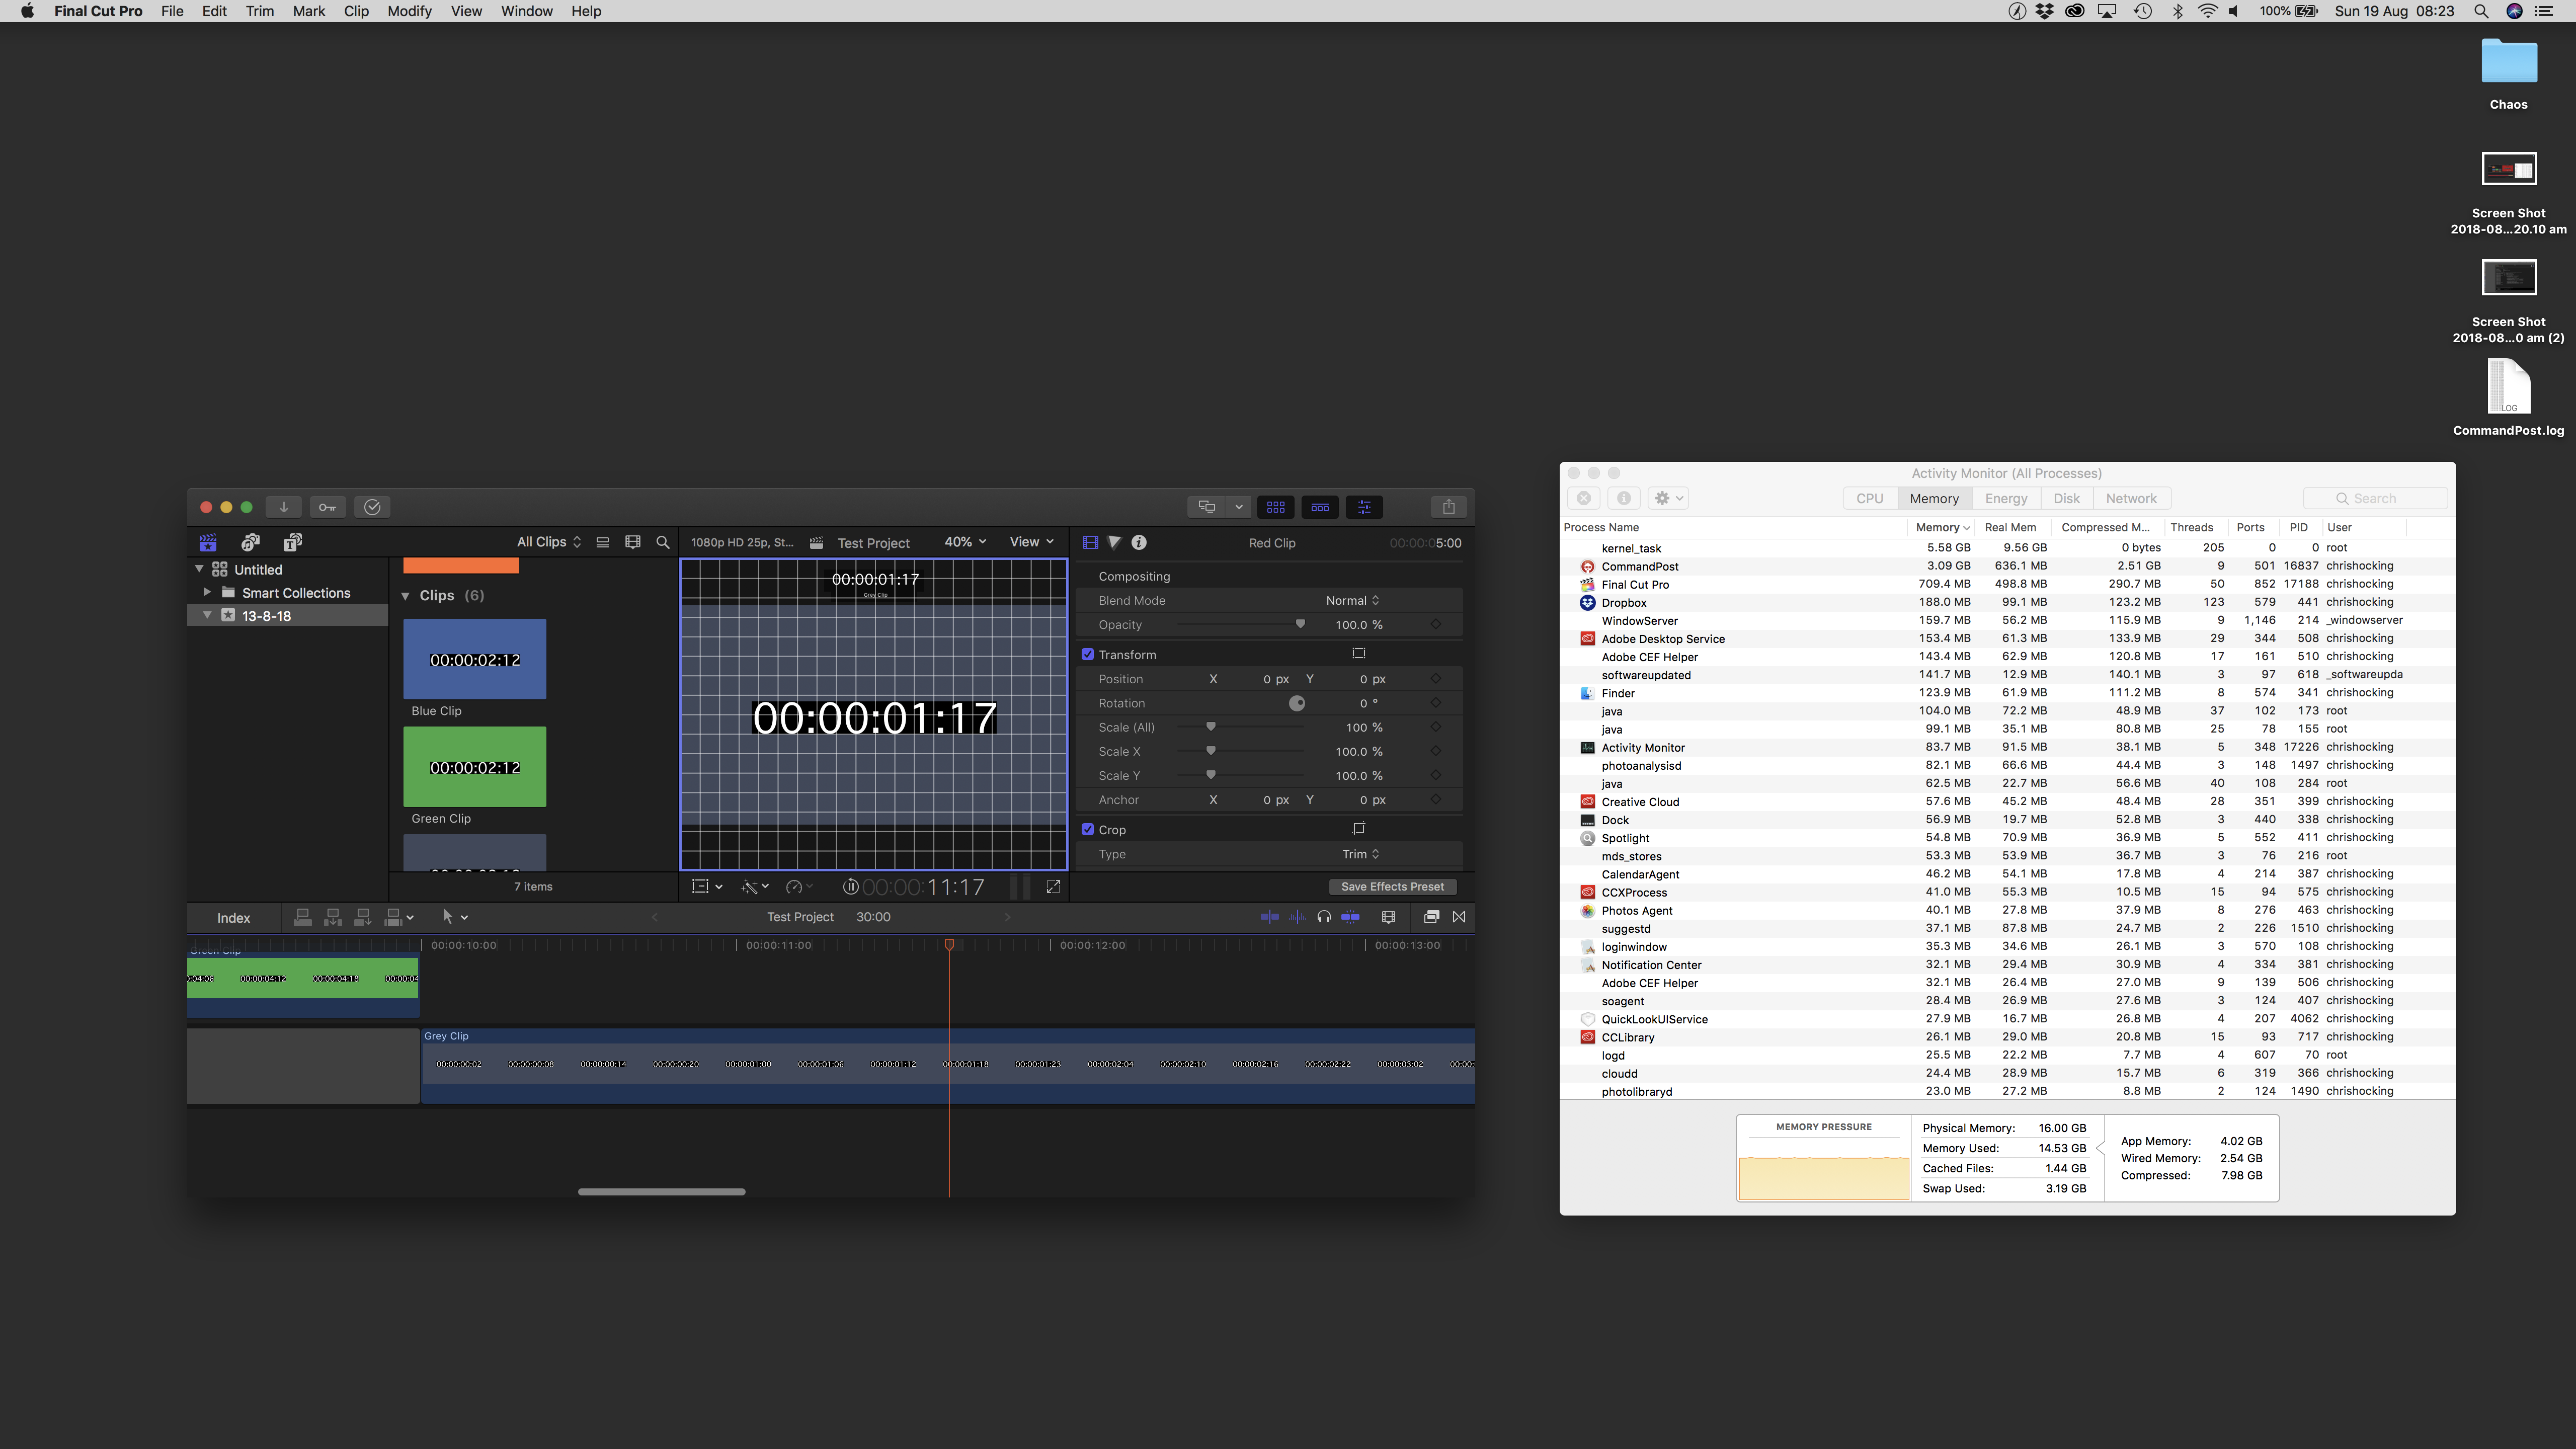
Here's what everything looked like when I woke up:
The minor victory was, that despite the fact that the memory pressure graph in Activity Monitor was looking very sad, CommandPost was still running and there was no "out of application memory" error - which is the first test this has happened for after running overnight. I stopped the timer, then checked the garbage collection values:
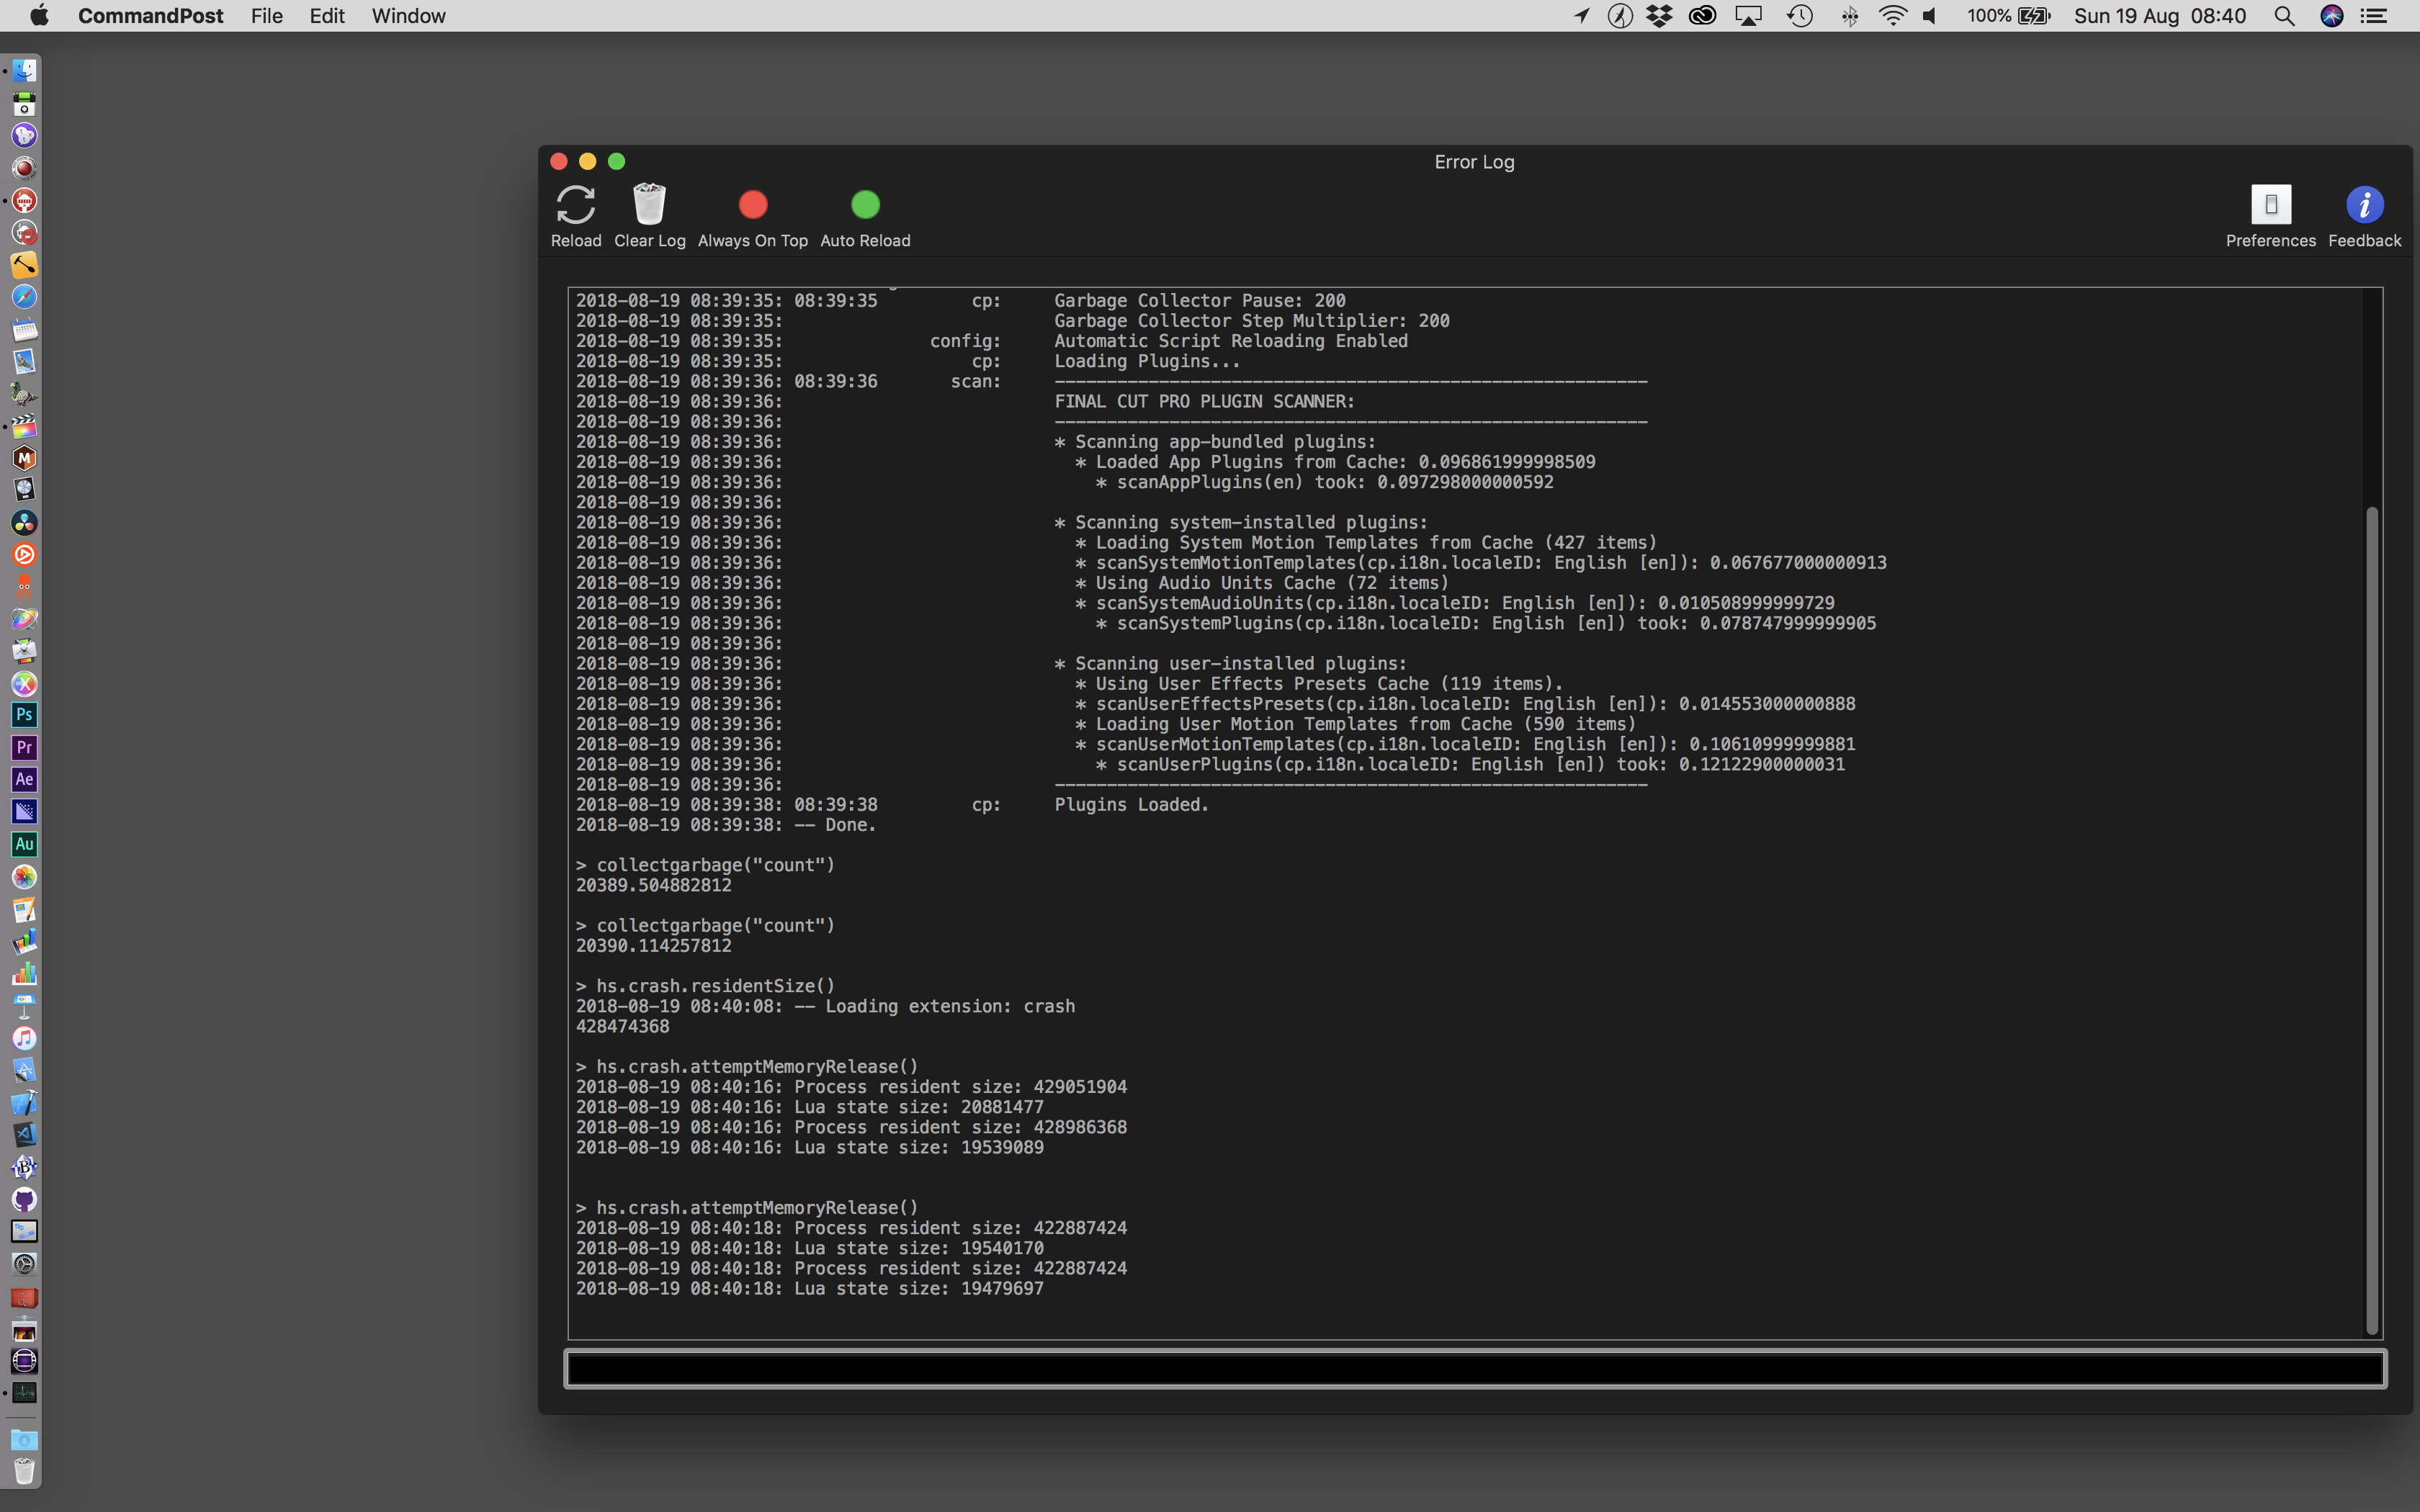
What's most interestingly though, is that I then pressed the "Reload" button in the Error Log, and when CommandPost reloaded, the memory pressure graph went back to normal - as did the
It seems This makes me think that the issue is still that we're creating too many AX objects (or too many AX observer objects?), that aren't being properly destroyed/released - which is why |


|
I'm going to close this issue for now - in the HOPE that the recent changes have fixed this issue. Fingers and toes crossed! |
No description provided.
The text was updated successfully, but these errors were encountered: