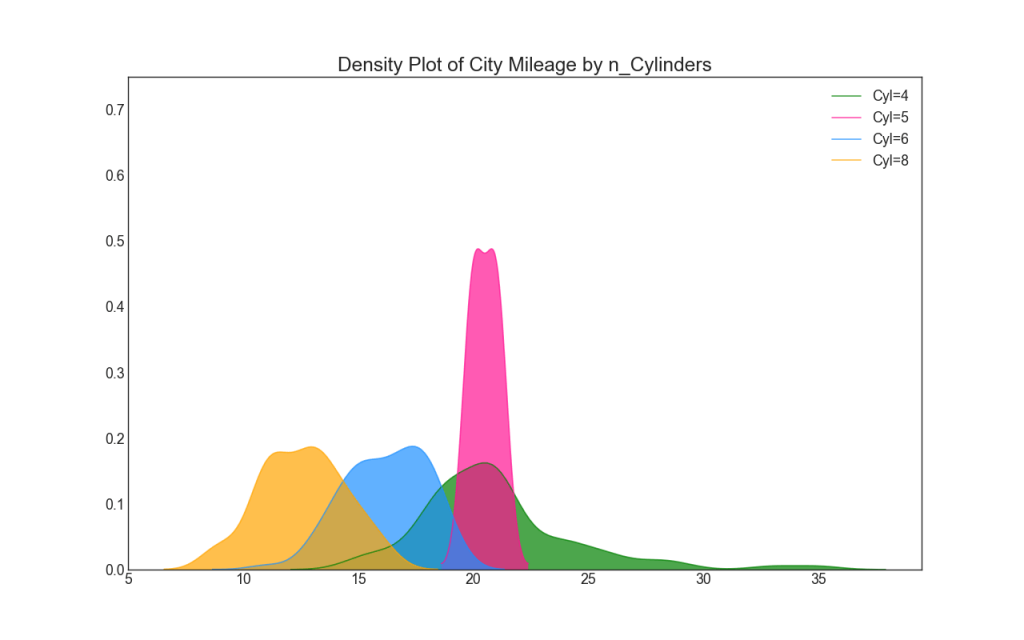
A compilation of purpose-based matplotlib plots most useful in data analysis and visualization. This list provides a real choice as to which visualization to use for what situation, using python’s matplotlib and seaborn library.
The charts are grouped based by purpose, with the most popular visualizations displayed. For example, if you want to picturize the relationship between 2 variables, then the ‘Correlation’ plots notebook is for you! Or if you want to show how a value changed over time, then take a look at the ‘Change’ notebook.
NOTE. An effective chart is one which:
- Conveys the right and necessary information without distorting facts.
- Simple in design, you dont have to strain in order to get it.
- Aesthetics support the information rather than overshadow it.
- Not overloaded with information.
1. Python installed |(latest version 3.+)
2. Anaconda installed |(lastest version)
There are two options you can use to run this code, rather than just view using the Jupyter Notebook (.ipynb) viewer, the link is below:
https://nbviewer.jupyter.org/github/DACommunityofPractice/Jupyter-Visualisations
-
Access the jupyter notebooks from the \finbilab02\landing\ location.
-
With Python and Anaconda installed on the server, you will be able to access the Jupyter notebooks stored within this (DACommunityofPractice) GitHub repository.
-
You will need use the 'Anaconda command line prompt' in order to get access the notebooks as follows:
-
Once the command line statement has run you will be able to view the following 'http://localhost:8888/tree' page, listing the files available to you to use.
-
Click on the file of your choice to run.
-
Access the jupyter notebooks from your own machine, having downloaded them from the '\finbilab02\landing' location.
-
In order run these files, you will have needed to have had Python and Anaconda installed on your machine.
-
Again, the 'Anaconda command line prompt' shown above will need used to access the notebooks.
If you are not able to run these notebooks, but would still like to view and or copy the code, then access the server using the Windows Explorer location: '\finbilab\landing' or download the files stored within this repository.
Right click on the notebook you are interested in, having first viewed the content useing the NBviewer link.
https://nbviewer.jupyter.org/github/DACommunityofPractice/Jupyter-Visualisations
To view the code within the .ipynb file, use the 'open with' righ-click mouse option to open the notebook in Notepad.
The data sets have also been stored in the pository for you to access.
Anthony Vidler & Lee Matthews (Creation of Jupyter notebooks from open source content)
Original source material posted on 'https://www.machinelearningplus.com/plots/top-50-matplotlib-visualizations-the-master-plots-python/'


