School project. Code smells visualizer.
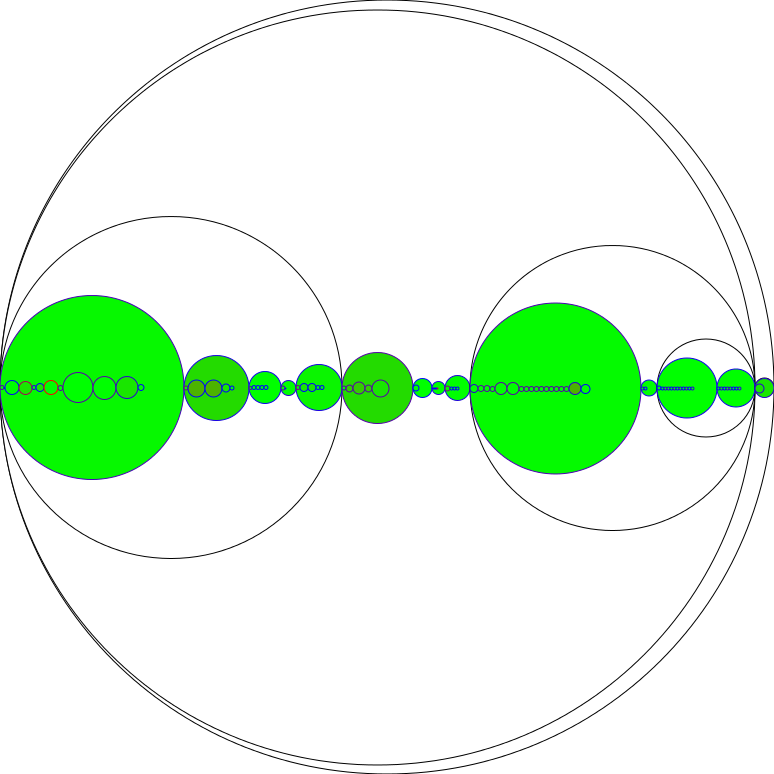
This is the generated code smell visualization for this projet.

This is a png, you can click on the picture to access the svg file.
Given a project path, our code in hierarchyView.visitors takes advantage of Javaparser to analyse java code. We search for some code smells and compile the metrics into objects representing classes and methods.
From that, we use the Apache Batik library to create svg elements for each classes and methods. Then, we put them in place so it represents the project.
You can run it with the jar file, the command is: java -jar CodeToPic.jar sourceFile destinationFolder
The generated circles are simple.
- White-filled circles with black stroke are the package in your project.
- Colored circles within packages are classes.
- Colored circles within classes are constructors and methods.
About the color, green means good, red is bad smell.
For methods, the fill color represents the Cyclomatic Complexity and the stroke color the parameter list. For classes, it's an average of methods' data.
The size for everything represents the number of line of code, the bigger the circle, the bigger the package/class/method.