The Problem
A palette is a predefined set of colors that are used to draw series. When a chart contains many series, the number of colors in a palette is insufficient to draw each series in a different color.
The Solution
We have allowed extending the base palette color set by introducing the new paletteExtensionMode option for the Chart component. This option specifies an algorithm that calculates the extra colors for a chart and can be set to the alternate, extrapolate or blend values.
Alternate Mode
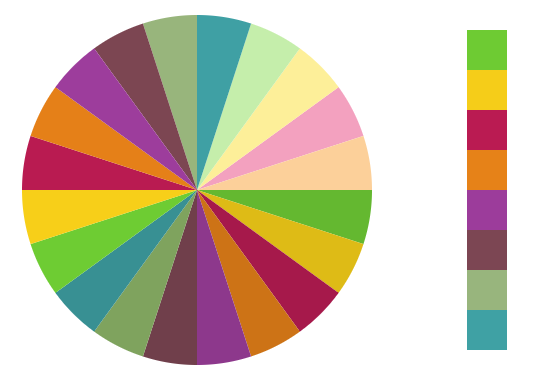
This was the previous default mode that is retained for backward compatibility. It replicates the original set of palette colors, alternating their brightness. The resulting palette includes lightened, darkened and standard colors. It has a limited set of colors (3x more than the original set).

Note: The default palette colors are shown on the right of the chart.
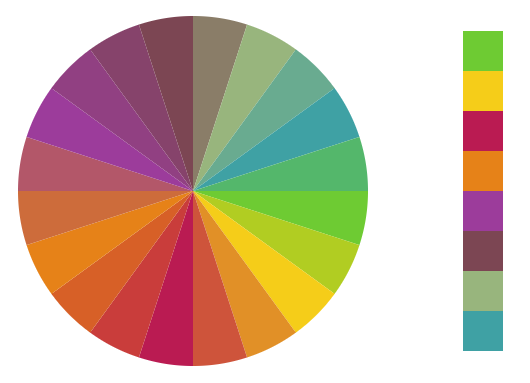
Extrapolate Mode
Replicates the original set of palette colors, changing their shade gradually from dark to light. Can have an unlimited set of colors.
Blend Mode
Creates a new color is by combining two neighboring palette colors. An unlimited number of colors can be created.
Try It And Give Us Feedback
Live Sandbox
jQuery
Angular
Installation
Follow the installation guide from the release page and leave us feedback on this topic.
Feel free to leave comments or use GitHub reactions.
The Problem
A palette is a predefined set of colors that are used to draw series. When a chart contains many series, the number of colors in a palette is insufficient to draw each series in a different color.
The Solution
We have allowed extending the base palette color set by introducing the new
paletteExtensionModeoption for the Chart component. This option specifies an algorithm that calculates the extra colors for a chart and can be set to thealternate,extrapolateorblendvalues.Alternate Mode
This was the previous default mode that is retained for backward compatibility. It replicates the original set of palette colors, alternating their brightness. The resulting palette includes lightened, darkened and standard colors. It has a limited set of colors (3x more than the original set).
Note: The default palette colors are shown on the right of the chart.
Extrapolate Mode
Replicates the original set of palette colors, changing their shade gradually from dark to light. Can have an unlimited set of colors.
Blend Mode
Creates a new color is by combining two neighboring palette colors. An unlimited number of colors can be created.
Try It And Give Us Feedback
Live Sandbox
jQuery
Angular
Installation
Follow the installation guide from the release page and leave us feedback on this topic.
Feel free to leave comments or use GitHub reactions.