Skip to content
New issue

Have a question about this project? Sign up for a free GitHub account to open an issue and contact its maintainers and the community.

By clicking “Sign up for GitHub”, you agree to our terms of service and privacy statement. We’ll occasionally send you account related emails.

Already on GitHub? Sign in to your account

Very bad limitation in Google Visualization API - Gantt charts #194

Closed
ORESoftware opened this issue Jul 4, 2017 · 17 comments
Closed

Very bad limitation in Google Visualization API - Gantt charts #194

ORESoftware opened this issue Jul 4, 2017 · 17 comments

Comments

@ORESoftware
Copy link

ORESoftware commented Jul 4, 2017

There are a couple problems I have seen in the google chart API

https://developers.google.com/chart/interactive/docs/gallery/ganttchart

Not sure if this is the right place to submit this issue.

Here are the problems I see:

  1. Google JS api cannot take a string or number and convert it to a Date. This is a problem when I pass the API JSON.stringified data. Dates must be a primitive, yet the Google API cannot interpret a number or a string as a Date. This a huge limitation.

  2. I am having trouble scaling things to millseconds, and working with millseconds. I am creating Gantt charts for computer processes, not human processes, so the scale is milliseconds. Is there an easy way to create Gantt charts that can scale to milliseconds? I don't see why not. Should be easy to implement. Just scale it down. But unfortunately it doesn't look like Google API can handle Dates with millisecond data.

Here is an example of the first problem:

<html>
<head>
  <script type="text/javascript" src="https://www.gstatic.com/charts/loader.js"></script>
  <script type="text/javascript">
    google.charts.load('current', {'packages':['gantt']});
    google.charts.setOnLoadCallback(drawChart);

    function drawChart() {

      var data = new google.visualization.DataTable();
      data.addColumn('string', 'Task ID');
      data.addColumn('string', 'Task Name');
      data.addColumn('string', 'Resource');
      data.addColumn('date', 'Start Time');
      data.addColumn('date', 'End Time');
      data.addColumn('number', 'Duration');
      data.addColumn('number', 'Percent Complete');
      data.addColumn('string', 'Dependencies');

      data.addRows(JSON.parse('[["1","regexp.js","some-resource","2017-07-04T22:06:17.465Z","2017-07-04T22:06:18.132Z",null,100,null]]'));

      var options = {
        height: 1200,
        gantt: {
          trackHeight: 30
        }
      };

      var chart = new google.visualization.Gantt(document.getElementById('chart_div'));
      chart.draw(data, options);
    }
  </script>
</head>
<body>
<div id="chart_div"></div>
</body>
</html>

above you will clearly see I have worked had to generate date strings, but yet Google API cannot convert them, even though they are entirely valid.

Lame! :)

@ORESoftware
Copy link
Author

ORESoftware commented Jul 4, 2017

I got it working like so:

      const val = JSON.parse('{{{arrayOfArrays}}}');

      const mapped = val.map(function(item){
         return [item[0], item[1], item[2], new Date(item[3]), new Date(item[4]), item[5], item[6], item[7] ];
      });

      data.addRows(mapped);

      var options = {
        height: 1200,
        gantt: {
          trackHeight: 30
        }
      };

      var chart = new google.visualization.Gantt(document.getElementById('chart_div'));

      chart.draw(data, options);

but frankly that was a bit tricky and I think you will make it harder for programming newbies, that it has to be.

@ORESoftware
Copy link
Author

ORESoftware commented Jul 4, 2017

Yeah so I don't think the Gantt chart handles anything more granular than days. That really sucks. I passed the Chart API two different tasks with different start Date / end Dates that differed by seconds, and the API can't handle that. Considering that the Duration value can take milliseconds, it seems to me incredibly limiting to not also accept milliseconds for start date and end date.

I am going to open a different issue for the start date end date.

@wesalvaro
Copy link
Member

The Gantt chart can do more resolution than days. This example shows using minutes but I haven't messed around too much with it myself.

As for the Date issue, how to represent them as strings is addressed here.

Let me know if you have any further questions, but these issues are unrelated to the Polymer element and you could probably get better, more timely help by posting to the discussion group or to the issue list.

@wesalvaro
Copy link
Member

@ORESoftware I just saw your issue and the post over on the library's issue list. I think that your issue comes when specifying the start Date. As in the example that I posted, the start and end Dates are null. You only need to populate duration, which I tweaked the example and it will show resolutions as high as 0.01 seconds.

@ORESoftware
Copy link
Author

ORESoftware commented Jul 5, 2017

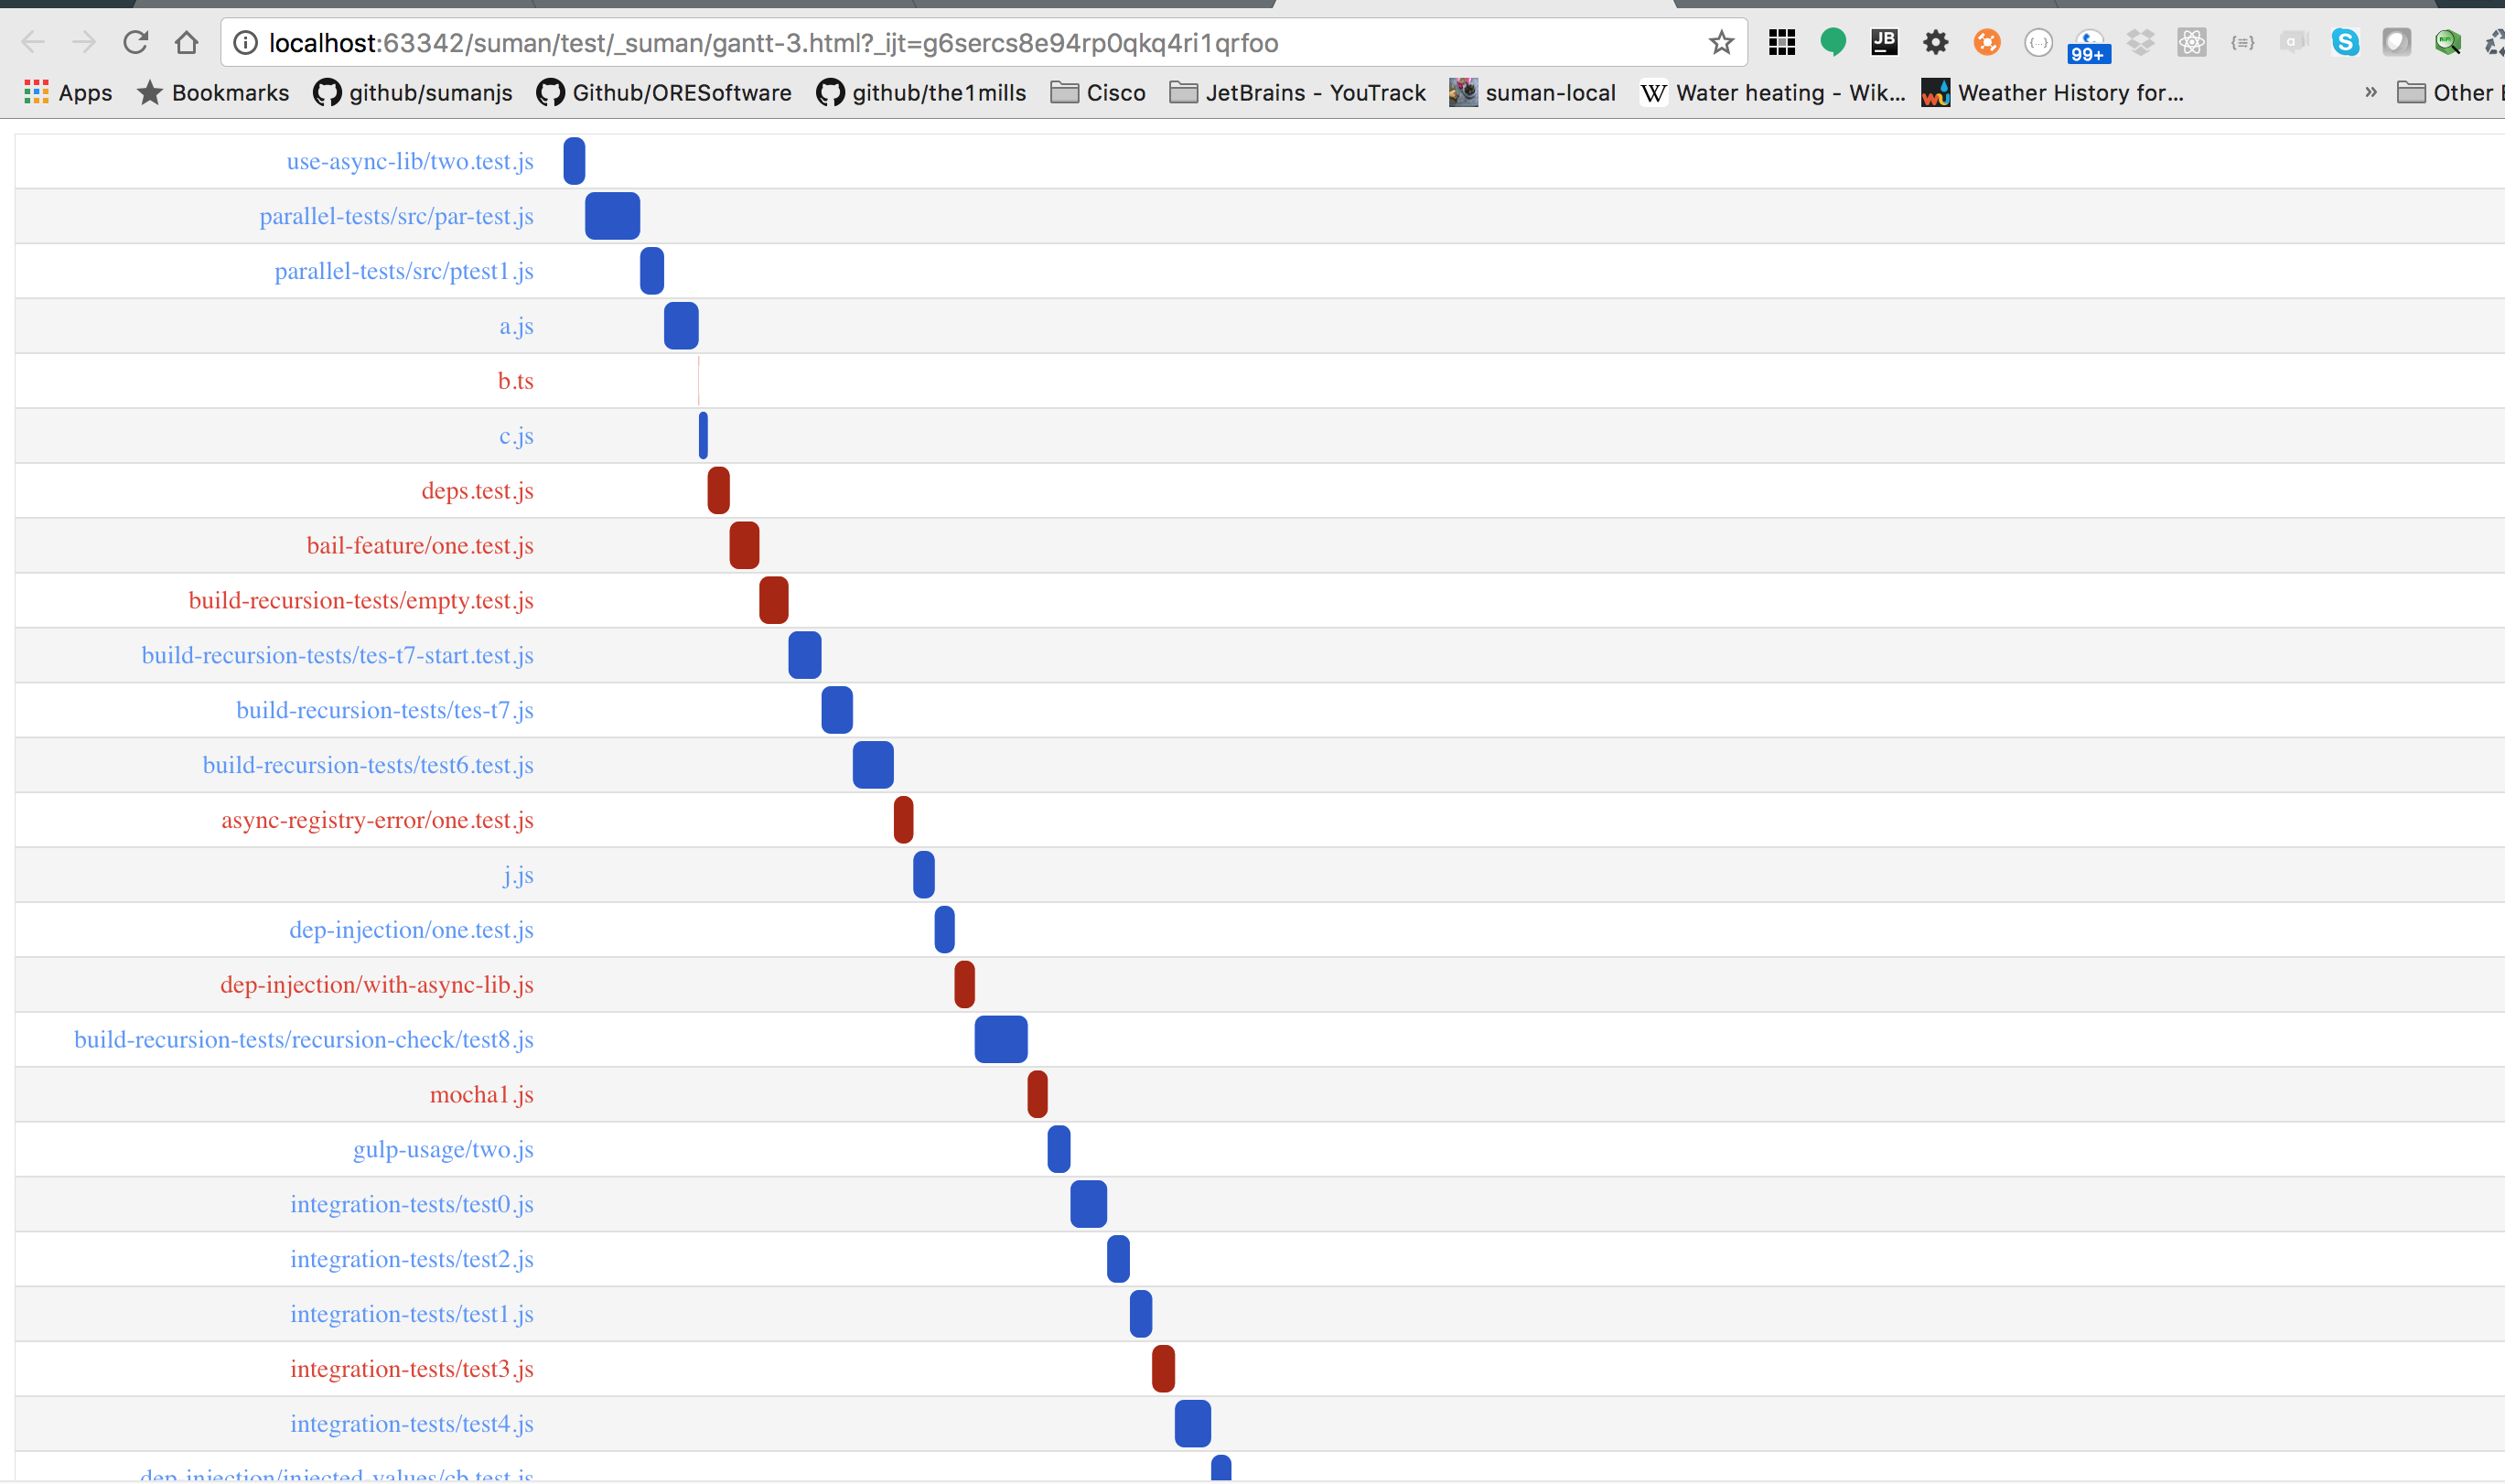
Thanks for responding to this issue. If I just use a duration, then I won't get the right start time. This is what I am looking for:

screenshot 2017-07-04 20 39 28

However to achieve the above, I had to do some real gymnastics, like I said, I had to translate milliseconds into days, LOL, it was not pleasant at all.

I clicked the link to find the example that uses minutes for start/end date, I couldn't find it.

Being able to do this with milliseconds would be nice because then the numbers/labels would be correct.

@wesalvaro
Copy link
Member

It looks like you might just want a timeline graph for that.

@ORESoftware
Copy link
Author

@wesalvaro thanks, do you have a good link for that?

@ORESoftware
Copy link
Author

Ok, I think this is what you mean: https://developers.google.com/chart/interactive/docs/gallery/timeline

yeah that's probably a lot better..my processes are always independent, whereas Gantt charts have process that are interdependent...thanks!

@wesalvaro
Copy link
Member

Cool. Let me know if you have any questions.

@ORESoftware
Copy link
Author

ORESoftware commented Dec 10, 2017

thanks for your help, I finally got this working with Timeline (I was using Gantt before)

screenshot 2017-12-09 18 19 47

the timeline has better default mouseover events, which is nice

I had this issue
https://stackoverflow.com/questions/47734952/label-color-or-bar-color-by-row-for-google-timeline-chart

but I figured out a solution pretty quickly to that

@ORESoftware
Copy link
Author

If you know how to add a legend to a Google Timeline chart, I could use one of those

@wesalvaro
Copy link
Member

wesalvaro commented Jan 15, 2018

For legends, you have two options:

  • Roll your own
  • Label the rows

You also don't need to use one row for each as you have it. It's a bit ... tall ... haha.
I would say something like the advanced example could fit your needs.

@sanj79
Copy link

sanj79 commented Jul 6, 2018

Hi @wesalvaro ,

Is it possible for Gantt chart labels to be placed inside the bars , instead of left aligned ?

@wesalvaro
Copy link
Member

@sanj79 Please see here for options on the Gantt chart.

@sanj79
Copy link

sanj79 commented Jul 7, 2018

@wesalvaro Doesn't help. Tried it, there is no mention on formatting of the labels, I'd like it to have the same style as other Gantt charts have , text placed inside the bars instead of being left aligned.
68755f2f5691ae3ef6d7acf5212e3dea

Is there any way to achieve it from the in-built functionality ?
Also, I'd like to remove them from the left, and any extra space which it might cause to be neutralized.

@wesalvaro
Copy link
Member

@sanj79 I'm not very familiar with the Gantt chart but it looks like you're right that it's not an option currently. You'll have better luck asking the Google Visualization community or opening an issue with them. This Polymer wrapper only passes along the available options.

@tawfikm
Copy link

tawfikm commented Jul 26, 2019

Hello I have a problem with google gantt chart, I can't see the chart drawing
this is my code:
`<script type="text/javascript">

  google.charts.load('current', {'packages':['gantt']});
  google.charts.setOnLoadCallback(drawChart);
  
  
  function runXHR(url) {
    const xhr = new XMLHttpRequest();
    xhr.addEventListener('loadend', handleEvent);
    xhr.open("GET", url);
    xhr.send();	
    return xhr;  
  }

function handleEvent(e) {
   var tab = [];
   var data = new google.visualization.DataTable();

	  data.addColumn('string', 'Task ID');
      data.addColumn('string', 'Task Name');
      data.addColumn('string', 'Resource');
      data.addColumn('date', 'Start Date');
      data.addColumn('date', 'End Date');
      data.addColumn('number', 'Duration');
      data.addColumn('number', 'Percent Complete');
      data.addColumn('string', 'Dependencies');

	var eventInfo = e.srcElement;

	jsonData = JSON.parse(eventInfo.response)
	
	  if (eventInfo.status >= 200 && eventInfo.status < 400) {
	    jsonData.forEach(task => {
	      var taskId = task.idt.toString();
	      var taskName = task.name;
	      var taskResource = task.resources.toString();
	      var taskStartDate = null;
	      var taskFinishDate = new Date(task.finishDate);
	      var taskDuration = 4.0;
	      var taskPcomplete = 10;
	      var taskPredec =  task.prdecessecors.toString();

	       var x = new Array(taskId, taskName, taskResource, taskStartDate, taskFinishDate,daysToMilliseconds(taskDuration), taskPcomplete, taskPredec);

	      tab.push(x);
	    })


	  console.log("Fetch: ", tab);

	  data.addRows(tab);

	  console.log("data: ", data);

        var options = {
          height: 275,
          gantt: {
            criticalPathEnabled: true,
            criticalPathStyle: {
              stroke: '#e64a19',
              strokeWidth: 5
            }
          }
        };

      var chart = new google.visualization.Gantt(document.getElementById('chart_div'));

      chart.draw(data, options);

	  } else {
	    console.log('error!!')
	  }
	
  // console.log(options);
  // console.log(data);

	}

 
  function drawChart() {
  	runXHR('http://localhost:8080/projects/5d3794add2e7cf1b544519f8/tasks')
     
  }

  function daysToMilliseconds(days) {
    return days * 24 * 60 * 60 * 1000;
  }

</script>`

Sign up for free to join this conversation on GitHub. Already have an account? Sign in to comment
Labels
None yet
Projects
None yet
Development

No branches or pull requests

4 participants