This is a GUI that plots mathematical functions using python and embedded matplotlib window inside.
All is needed from you is:
- Write Your function whose variable is x.
- Write Both Min x and Max x limits that will show up in the graph.
- Press "Plot Function" Button and see the result.
This window will show up initially when you open the GUI

Note: There's a status bar down to show plotting status (Success/Fail)
- Working Examples
- y = x^2 + 6*x

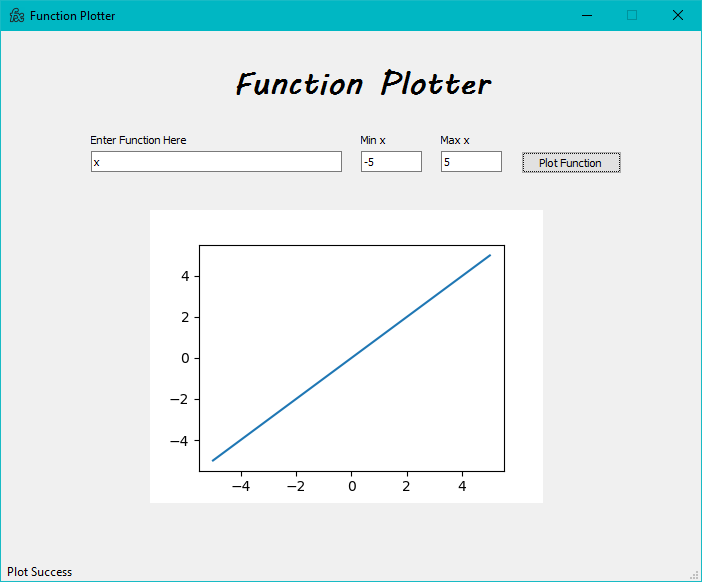
- y = x
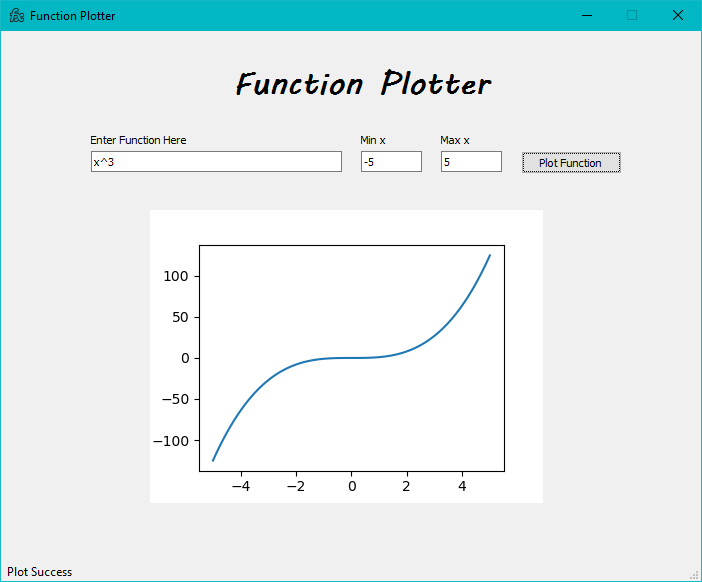
- y = x^3
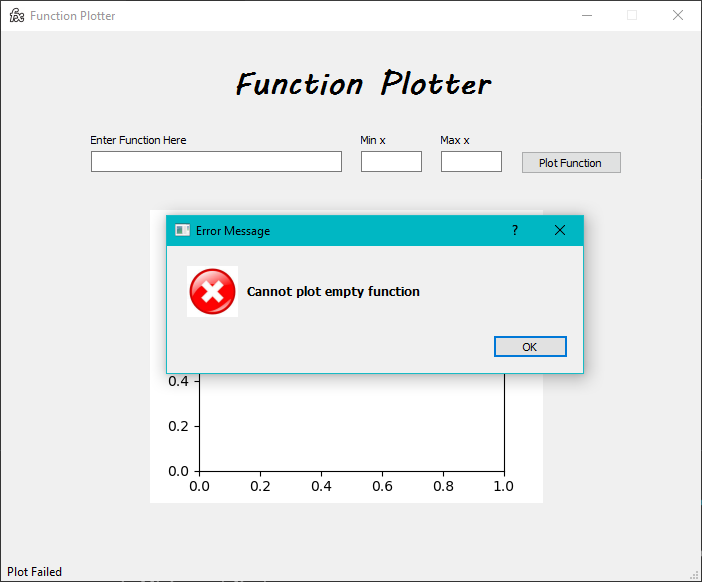
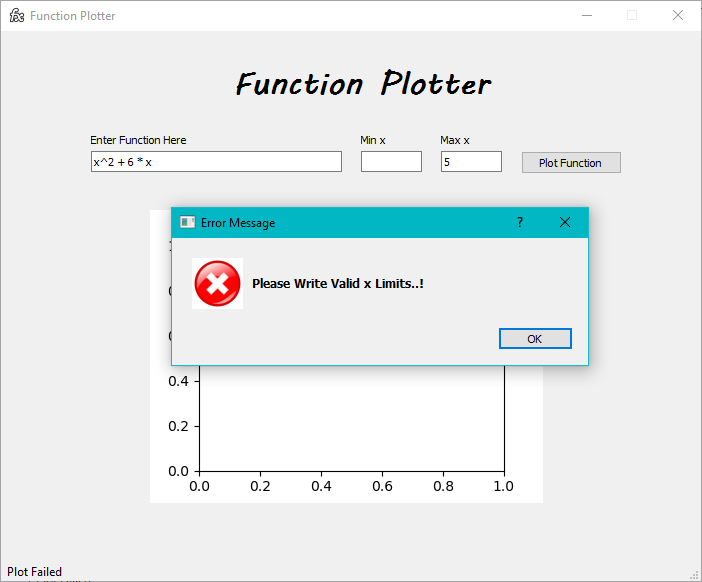
- Wrong Examples
- Empty Entries
- Empty Max x entry

- Empty Min x entry
- Wrong Function or typo
