
IBM Db2 Event Store offers high-speed ingestion and real-time analytics for large volumes of streaming data. The platform enables event-driven applications to persist event data at scale and powers high performance Spark analytics on all data for quick insights. In this code pattern, we will see how a retail business uses IBM Db2 Event Store to capture and analyze clickstream data from its web channels. The clickstream analysis helps the business to closely track customer browsing patterns and better understand their changing interests. Acting on these insights, the business offers a personalized experience for every customer with targeted offers to drive sales.
Sample notebooks demonstrate the use case of clickstream analysis with IBM Db2 Event Store using Scala APIs to ingest and analyze web event data. Credit goes to Siva Anne of the IBM Data Science Elite Team for the original Jupyter Notebooks.
When the reader has completed this code pattern, they will understand how to:
- Install IBM Db2 Event Store developer edition
- Ingest data into Event Store using Scala in a Jupyter Notebook
- Query the Event Store using Scala and Spark SQL in a Jupyter Notebook
- Use Brunel to visualize the data with interactive charts

- Add a CSV file as a data asset
- Run a Jupyter Notebook using Scala to ingest data from the CSV file into Event Store
- Run a Jupyter Notebook using Scala and the Brunel visualization language to analyze the data from Event Store
- IBM Db2 Event Store: In-memory database optimized for event-driven data processing and analysis.
- Jupyter Notebook: An open source web application that allows you to create and share documents that contain live code, equations, visualizations, and explanatory text.
- Scala: Scala combines object-oriented and functional programming in one concise, high-level language.
- Brunel: Brunel defines a highly succinct and novel language that defines interactive data visualizations based on tabular data.
- Databases: Repository for storing and managing collections of data.
- Analytics: Analytics delivers the value of data for the enterprise.
- Data Science: Systems and scientific methods to analyze structured and unstructured data in order to extract knowledge and insights.
- Install IBM Db2 Event Store Developer Edition
- Clone the repo
- Add the CSV file as a data asset
- Import and run the Jupyter Notebook to ingest data
- Import and run the Jupyter Notebook to analyze the data
- See the results
Install IBM® Db2® Event Store Developer Edition on Mac, Linux, or Windows by following the instructions here.
Note: This code pattern was developed with Event Store Developer Edition 1.1.4
Clone the db2-event-store-clickstream locally. In a terminal, run:
git clone https://github.com/IBM/db2-event-store-clickstreamUse the Db2 Event Store UI to add the CSV input file as a data asset.
-
From the upper-left corner
☰drop down menu, selectMy Notebooks.
-
Scroll down and click on
add data assets.
-
Click
browseand navigate to thedatadirectory in your cloned repo. Open the fileclickstream_data.csv.


Use the Db2 Event Store UI to create, edit, and run the notebook.
-
From the upper-left corner
☰drop down menu, selectMy Notebooks. -
Click on
add notebooks. -
Select the
From Filetab. -
Provide a name.
-
Click
Choose Fileand navigate to thenotebooksdirectory in your cloned repo. Open the fileingest_clickstream_events.ipynb. -
Scroll down and click on
Create Notebook.
-
Edit the
HOSTconstant in the first code cell. You will need to enter your host's IP address in place of theXXX.XXX.XXX.XXXvalue. -
Run the notebook using the menu
Cell>Run allor run the cells individually with theplaybutton.

This notebook demonstrates how to:
- Connect to Event Store
- Create a database
- Drop a database
- Create a table
- Load data from a CSV file or a DataFrame
Use the Db2 Event Store UI to create, edit, and run the notebook.
-
Follow the same steps as above, but select the file
analyze_clickstream_events.ipynbfrom your repo'snotebooksdirectory. -
Edit the
HOSTconstant in the first code cell. You will need to enter your host's IP address in place of theXXX.XXX.XXX.XXXvalue. -
Run the notebook using the menu
Cell>Run allor run the cells individually with theplaybutton.
This notebook demonstrates how to:
- Connect to Event Store
- Query Event Store using Spark SQL
- Prepare and aggregate data for analysis
- Use Brunel to create interactive charts
-
Code cells that prepare DataFrames with calculated and aggregated fields include show() output to give you a peek at the data as it is being processed.

-
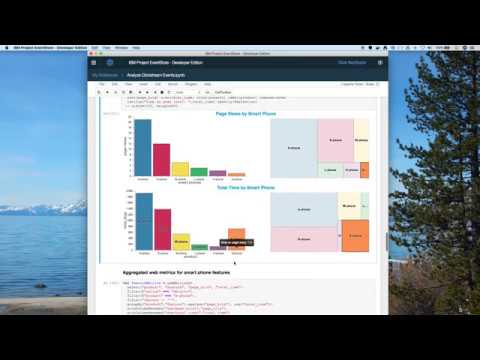
The first Brunel charts use aggregated web metris for product lines. Here we show 4 charts to help you compare page views with time spent on web pages.
-
The bar charts use the same order and color for product lines (sorted by page hits). The charts are placed with one directly below the other so that your eyes will easily spot where they differ.
-
The charts show that
smart phonesweb pages are the most popular in both page views and time spent on pages. -
videogamesstands out as a product line with significantly highertotal timerelative to itspage hits.
-
-
Notice the tooltips when you hover over the bars.
-
Click on the
videogamesbar.- The charts are wired so that when you select a bar, it will highlight that product line's area in the treemap charts. The treemap charts, on the right side, show another way to visualize the relative stats of the product lines. The top one is weighted by page views. The bottom one is weighted by time spent on web pages.

-
-
The next Brunel charts show aggregated web metris for products in the
smart phonesproduct line. Here we show 4 charts similar to those described above.-
These charts show that the
A-phoneis the leading smart phone product in terms of both page hits and time spent on a page. -
Notice that the
X-phonestands out as the phone with higher time spent on web pages per page view.

-
-
Next we look at specific features of the
A-phone.-
Here we use a bar chart to show page views by feature and a pie chart to show time spent on pages.
-
Clicking on a bar will highlight the same feature in the pie chart.
-
The tool tips show additional information when hovering over bars or pie slices.
-
colorwas the most important feature for both page views and time spent on web pages.
-

-
-
Finally, after more data manipulation, we look into web metrics for a specific user.
-
This view could be used by a support agent or a targeted offering campaign to analyze a user's current interests.
- This user has shown significant interest in smart phones.
- This user has also visited web pages for headphones and computers.
-
A legend is displayed on the right. Color is by product line.
-
The bar chart shows the user's page views over the past seven days. A stacked bar is used to show each product line viewed.
-
Clicking on a bar will highlight the pie chart slices for that day and that product line.
- The pie slices are also divided by day and product.
- The pie chart tool-tip shows how you can use HTML tags for formatting in a tool-tip.

-


See the notebook with example output and interactive charts here.
- Ingest and Analyze Streaming Event Data at Scale with IBM Db2 EventStore
- Fast Data Ingestion, ML Equates to Smarter Decisions Faster
- Overview of IBM Db2 Event Store Enterprise Edition
- Developer Guide for IBM Db2 Event Store Client APIs
- Db2 Event Store Product Page
- Getting Started with Scala and sbt
- Data Analytics Code Patterns: Enjoyed this code pattern? Check out our other data analytics code patterns
- AI and Data Code Pattern Playlist: Bookmark our playlist with all of our code pattern videos
- IBM Watson Studio: Master the art of data science with IBM's Watson Studio
This code pattern is licensed under the Apache License, Version 2. Separate third-party code objects invoked within this code pattern are licensed by their respective providers pursuant to their own separate licenses. Contributions are subject to the Developer Certificate of Origin, Version 1.1 and the Apache License, Version 2.