In this example, you'll be creating a Python script to visualize the weather of 500+ cities across the world of varying distance from the equator. To accomplish this, you'll be utilizing a simple Python library, the OpenWeatherMap API, and a little common sense to create a representative model of weather across world cities.
The first requirement is to create a series of scatter plots to showcase the following relationships:
- Temperature (F) vs. Latitude

- Humidity (%) vs. Latitude

- Cloudiness (%) vs. Latitude

- Wind Speed (mph) vs. Latitude

The second requirement is to run linear regression on each relationship. This time, separate the plots into Northern Hemisphere (greater than or equal to 0 degrees latitude) and Southern Hemisphere (less than 0 degrees latitude):
- Northern Hemisphere - Temperature (F) vs. Latitude
- Southern Hemisphere - Temperature (F) vs. Latitude
- Northern Hemisphere - Humidity (%) vs. Latitude
- Southern Hemisphere - Humidity (%) vs. Latitude
- Northern Hemisphere - Cloudiness (%) vs. Latitude
- Southern Hemisphere - Cloudiness (%) vs. Latitude
- Northern Hemisphere - Wind Speed (mph) vs. Latitude
- Southern Hemisphere - Wind Speed (mph) vs. Latitude


- Southern Hemisphere stays warmer then the Northern Hemisphere based on minimum Tempatures.
- There is no signfigant correlation between humidity and latitude.
- Wind Speeds do not have a signifigant change between north and south hemispheres.
-
Now let's use your skills in working with weather data to plan future vacations. Use jupyter-gmaps and the Google Places API for this part of the assignment.
-
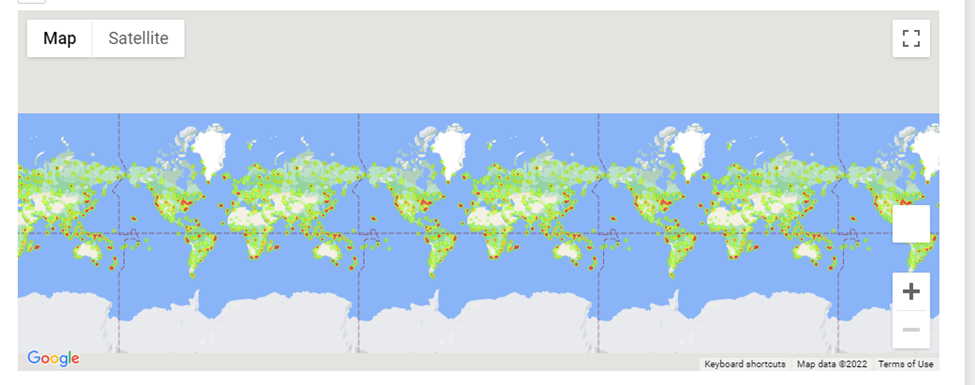
Create a heat map that displays the humidity for every city from Part I.
-
Narrow down the DataFrame to find your ideal weather condition. For example:
-
A max temperature lower than 80 degrees but higher than 70.
-
Wind speed less than 10 mph.
-
Zero cloudiness.
-
Drop any rows that don't contain all three conditions. You want to be sure the weather is ideal.
-
Note: Feel free to adjust to your specifications but be sure to limit the number of rows returned by your API requests to a reasonable number.
-
-
Using Google Places API to find the first hotel for each city located within 5000 meters of your coordinates.
-
Plot the hotels on top of the humidity heatmap with each pin containing the Hotel Name, City, and Country.
