


This Python package provides an implementation of visibility graph (VG) based approaches for detecting R-peaks in ECG signals. The utilized visibility graph transformation maps a given signal into a graph representation by expressing sampling locations as nodes and establishing edges between mutually visible samples. Subsequently, graph information is used to determine the R-peak positions.
In [1] and [2] benchmarking on several popular databases showed that the visibility graph based methods allow for sample-accurate R-peak detection and provide significantly superior performance compared to popular R-peak detectors.
You can install the latest version of the ‘vg-beat-detectors’ package from the Python Package Index (PyPI) by running:
pip install vg-beat-detectors
Additionally, the source code is available on GitHub.
When you are using this Package in your scientific publication, please cite:
J. Emrich, T. Koka, S. Wirth and M. Muma, "Accelerated Sample-Accurate R-Peak Detectors Based on Visibility Graphs," 2023 31st European Signal Processing Conference (EUSIPCO), Helsinki, Finland, 2023, pp. 1090-1094, doi: 10.23919/EUSIPCO58844.2023.10290007.
@INPROCEEDINGS{emrich2023,
author={Emrich, Jonas and Koka, Taulant and Wirth, Sebastian and Muma, Michael},
booktitle={2023 31st European Signal Processing Conference (EUSIPCO)},
title={Accelerated Sample-Accurate R-Peak Detectors Based on Visibility Graphs},
year={2023},
volume={},
number={},
pages={1090-1094},
doi={10.23919/EUSIPCO58844.2023.10290007}}This section illustrates, the basic usage of the ‘FastNVG’ and ‘FastWHVG’ detectors [1], which utilize the natural visibility graph (NVG) and weighted horizontal visibility graph (WHVG), respectively.
For both the ‘FastNVG’ and the ‘FastWHVG’ detectors, this package
provides an identically named class that is initialized with the
sampling frequency ‘fs’ of the given ECG signal. R-peaks can then be
determined by applying the detectors find_peaks(ecg) method on the ECG
signal.
This is exemplified in the following by means of the pseudo variables
fs and ecg:
- FastNVG
from vg_beat_detectors import FastNVG

detector = FastNVG(sampling_frequency=fs)
rpeaks = detector.find_peaks(ecg)- FastWHVG
from vg_beat_detectors import FastWHVG

detector = FastWHVG(sampling_frequency=fs)
rpeaks = detector.find_peaks(ecg)The next example demonstrates the application of the ‘FastNVG’ detector using real-world ECG data provided by the ‘scipy’ package. The utilization of the ‘FastWHVG’ is analogous.
# import the FastNVG detector
from vg_beat_detectors import FastNVG

# import packages used in this example
import numpy as np
import matplotlib.pyplot as plt
from scipy.datasets import electrocardiogram

# generate some ECG signal
ecg = electrocardiogram() # sampling frequency of this excerpt is 360Hz
fs = 360
time = np.arange(ecg.size) / fs

# visibility graph R-peak detector
detector = FastNVG(sampling_frequency=fs)
R_peaks = detector.find_peaks(ecg)

# plot signal and detected peaks
plt.plot(time,ecg)
plt.plot(time[R_peaks],ecg[R_peaks],'X')
plt.xlabel("time in s")
plt.ylabel("ECG in mV")
plt.xlim(9, 10.2)
#> (9.0, 10.2)
plt.ylim(-1, 1.5)
#> (-1.0, 1.5)
plt.show()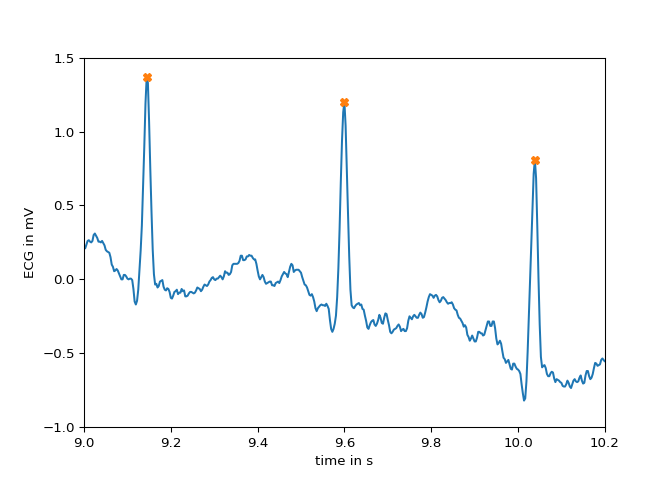
For advanced and experimental usage, the package provides the ‘VisGraphDetector’ base class, in which a number of parameters can be set, which will be briefly explained in the next paragraphs. For further understanding of the listed options and their influence on the algorithm, the interested user is referred to the papers [1] and [2].
The advanced usage follows the same structure as presented above:
from vg_beat_detectors import VisGraphDetector

detector = VisGraphDetector(sampling_frequency=250,
                            graph_type='nvg',
                            edge_weight=None,
                            beta=0.55,
                            accelerated=False,
                            window_overlap=0.5,
                            window_length=2,
                            lowcut=4.0)

rpeaks = detector.find_peaks(ecg)The underlying visibility graph transformation can be selected with
graph_type. The option ‘nvg’ results in the natural visibility graph
and ‘hvg’ in the horizontal visibility graph.
The edges in the visibility graph representation can be constructed with
a weighting factor. Therefore, the option edge_weight determines the
metric for calculating the edge weight between two nodes (or samples).
Available weights are ‘distance’, ‘sq_distance’, ‘v_distance’, ‘abs_v_distance’, ‘h_distance’, ‘abs_h_distance’, ‘slope’, ‘abs_slope’, ‘angle’ and ‘abs_angle’ as well as None for no weighting.
For further explanation of each available weight, see the documentation of the ‘ts2vg’ package.
The acceleration technique proposed in [1] which reduces the input
signal to only local maxima samples can be enabled or disabled by
setting accelerated to True or False, respectively. The
acceleration results in a run-time reduction by one order of magnitude
while the detection accuracy remains comparable to that of the
non-accelerated detector.
As described in [1,2], the choice of the sparsity parameter
beta as described in [1,2],
when changes have been made to the graph_type and edge_weight
options.
The input ECG signal is processed segment-wise using segments with a
default length of 2 sec and an overlap of 50%, i.e., window_length=2
and window_overlap=0.5. As their name suggests, these parameters allow
for adjustments of the window length and overlap.
To change the lower cutoff frequency of the highpass filter that
pre-processes the input ECG signal, the parameter lowcut can be
modified. The default value is
[1] Emrich, J., Koka, T., Wirth, S. and Muma, M. (2023). Accelerated Sample-Accurate R-Peak Detectors Based on Visibility Graphs.
[2] Koka, T. and Muma, M. (2022). Fast and Sample Accurate R-Peak Detection for Noisy ECG Using Visibility Graphs. 121-6.