Skip to content
New issue

Have a question about this project? Sign up for a free GitHub account to open an issue and contact its maintainers and the community.

By clicking “Sign up for GitHub”, you agree to our terms of service and privacy statement. We’ll occasionally send you account related emails.

Already on GitHub? Sign in to your account

show_%_guides does not work for Horizontal charts #345

Open
yossisal opened this issue Oct 17, 2016 · 3 comments
Open

show_%_guides does not work for Horizontal charts #345

yossisal opened this issue Oct 17, 2016 · 3 comments

Comments

@yossisal
Copy link
Contributor

yossisal commented Oct 17, 2016

When using a horizontal based chart, show_x_guides and show_y_guides have no effect.
Is there another way to show a full grid?

chart = pygal.HorizontalBar(
    show_x_guides=True,
    show_y_guides=True
)

chart.x_labels = ['a', 'b', 'c']
chart.add('A', [10,-20,5])

true

chart = pygal.HorizontalBar(
    show_x_guides=False,
    show_y_guides=False
)

chart.x_labels = ['a', 'b', 'c']
chart.add('A', [10,-20,5])

false

@santiagobasulto
Copy link

Hello @paradoxxxzero, is this one resolved? I saw #349 merged, but is it available on pypi? I just installed pygal (pygal==2.4.0) but I can't hide the vertical bars:

results = [
    (2.5280751287937164e-05, 0.06430051801726222, 748.1971608698368),
    (0.0008648261427879333, 0.0006550783291459084, 37.031489313114434),
    (0.014558483846485615, 1.4234799891710281e-05, 0.013818513136357069),
    (0.0052270847372710705, 0.004670494701713324, 0.010720287915319204)
]

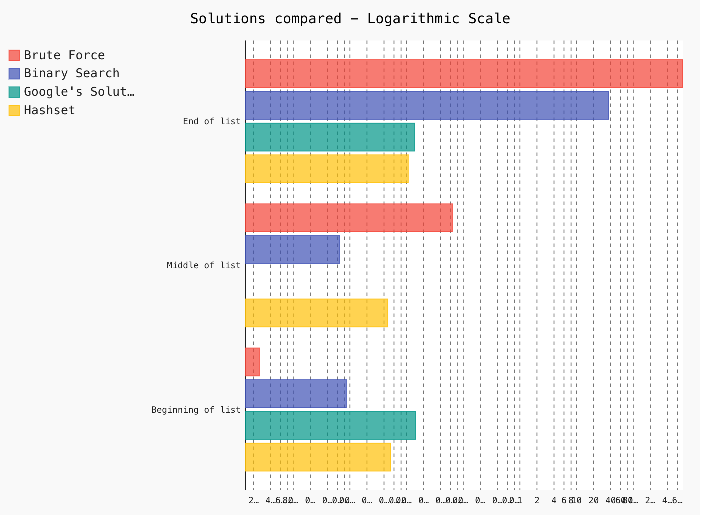
bar_chart = pygal.HorizontalBar(logarithmic=True, show_x_guides=False, show_y_guides=False)
bar_chart.title = 'Solutions compared - Logarithmic Scale'
bar_chart.x_labels = ['Beginning of list', 'Middle of list', 'End of list']

bar_chart.add('Brute Force', results[0])
bar_chart.add('Binary Search', results[1])
bar_chart.add("Google's Solution", results[2])
bar_chart.add("Hashset", results[3])

bar_chart.render()

image

@maxims94
Copy link

maxims94 commented May 3, 2019

It has not been resolved on 2.4.0-2.
My workaround was to set show_x_labels=false (of course, the labels will disappear also [EDIT: The y-labels will disappear, not the x-labels!]). There seems to be an adverse connection between show_x_labels and show_%x_guides (probably has to do with the transposition of values in HorizontalBar)

For experimentation:
bar_chart = pygal.HorizontalBar(show_x_labels=False) # or set to True bar_chart.title = 'Browser usage evolution (in %)' bar_chart.x_labels = map(str, range(2002, 2013)) bar_chart.add('Firefox', [None, None, 0, 16.6, 25, 31, 36.4, 45.5, 46.3, 42.8, 37.1]) bar_chart.add('Chrome', [None, None, None, None, None, None, 0, 3.9, 10.8, 23.8, 35.3]) bar_chart.add('IE', [85.8, 84.6, 84.7, 74.5, 66, 58.6, 54.7, 44.8, 36.2, 26.6, 20.1]) bar_chart.add('Others', [14.2, 15.4, 15.3, 8.9, 9, 10.4, 8.9, 5.8, 6.7, 6.8, 7.5]) bar_chart.render()

@cristianoccazinsp
Copy link

Having the same issue, any updates?

Sign up for free to join this conversation on GitHub. Already have an account? Sign in to comment
Labels
None yet
Projects
None yet
Development

No branches or pull requests

4 participants