This is a fork of oliver006/redis_exporter to export the kvrocks metrics.
git clone https://github.com/RocksLabs/kvrocks_exporter.git
cd kvrocks_exporter
go build .
./kvrocks_exporter --versionAdd a block to the scrape_configs of your prometheus.yml config file:
scrape_configs:
  - job_name: kvrocks_exporter
    static_configs:
    - targets: ['<<KVROCKS-EXPORTER-HOSTNAME>>:9121']
and adjust the host name accordingly.
To have instances in the drop-down as human readable names rather than IPs, it is suggested to use instance relabelling.
For example, if the metrics are being scraped via the pod role, one could add:
          - source_labels: [__meta_kubernetes_pod_name]
            action: replace
            target_label: instance
            regex: (.*kvrocks.*)
as a relabel config to the corresponding scrape config. As per the regex value, only pods with "kvrocks" in their name will be relabelled as such.
Similar approaches can be taken with other role types depending on how scrape targets are retrieved.
Run the exporter with the command line flag --kvrocks.addr= so it won't try to access the local instance every time the /metrics endpoint is scraped.
scrape_configs:
  ## config for the multiple kvrocks targets that the exporter will scrape
  - job_name: 'kvrocks_exporter_targets'
    static_configs:
      - targets:
        - kvrocks://first-kvrocks-host:6666
        - kvrocks://second-kvrocks-host:6667
        - kvrocks://second-kvrocks-host:6668
        - kvrocks://second-kvrocks-host:6669
    metrics_path: /scrape
    relabel_configs:
      - source_labels: [__address__]
        target_label: __param_target
      - source_labels: [__param_target]
        target_label: instance
      - target_label: __address__
        replacement: <<KVROCKS-EXPORTER-HOSTNAME>>:9121

  ## config for scraping the exporter itself
  - job_name: 'kvrocks_exporter'
    static_configs:
      - targets:
        - <<KVROCKS-EXPORTER-HOSTNAME>>:9121
The kvrocks instances are listed under targets, the kvrocks exporter hostname is configured via the last relabel_config rule.
If authentication is needed for the kvrocks instances then you can set the password via the --kvrocks.password command line option of
the exporter (this means you can currently only use one password across the instances you try to scrape this way. Use several
exporters if this is a problem).
You can also use a json file to supply multiple targets by using file_sd_configs like so:
scrape_configs:
  - job_name: 'kvrocks_exporter_targets'
    file_sd_configs:
      - files:
        - targets-kvrocks-instances.json
    metrics_path: /scrape
    relabel_configs:
      - source_labels: [__address__]
        target_label: __param_target
      - source_labels: [__param_target]
        target_label: instance
      - target_label: __address__
        replacement: <<KVROCKS-EXPORTER-HOSTNAME>>:9121

  ## config for scraping the exporter itself
  - job_name: 'kvrocks_exporter'
    static_configs:
      - targets:
        - <<KVROCKS-EXPORTER-HOSTNAME>>:9121
The targets-kvrocks-instances.json should look something like this:
[
  {
    "targets": [ "kvrocks://kvrocks-host-01:6666", "kvrocks://kvrocks-host-02:6667"],
    "labels": { }
  }
]
Prometheus uses file watches and all changes to the json file are applied immediately.
For Grafana 8.x, the default Prometheus data store access mode was Server which may have
the CORS issue, you can workaround this by choosing the browser mode or fix the CORS problem.

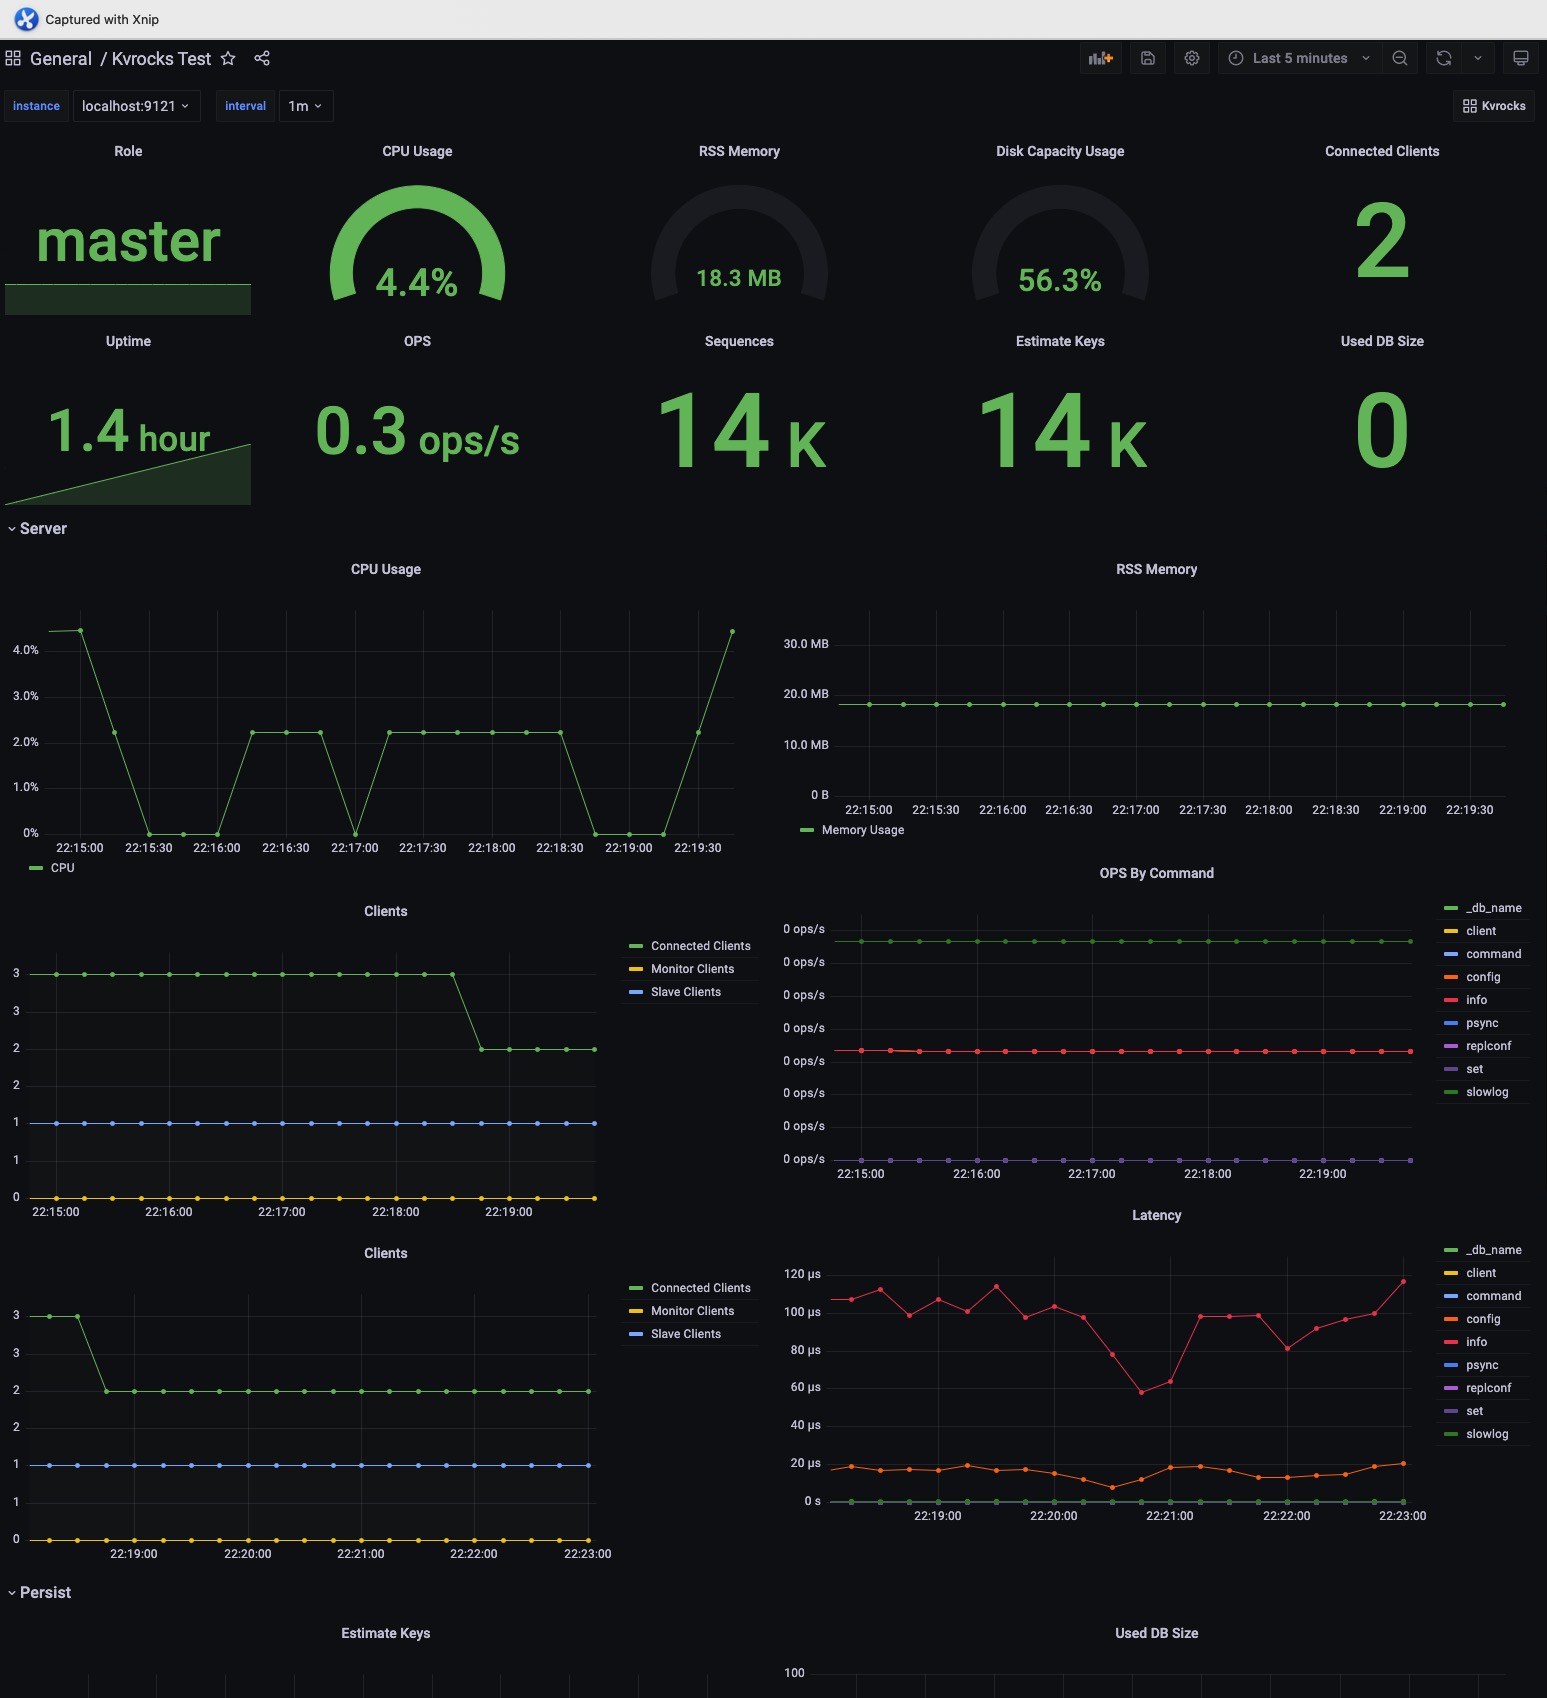
Kvrocks Grafana dashboard template is available on Grafana.com and imports
the Dashboard with ID 15286 or download the JSON file.
Example Grafana screenshots:
Open an issue or PR if you have more suggestions, questions or ideas about what to add.