This repository has been archived by the owner on Jul 17, 2023. It is now read-only.
Draw column series chart from a dataTable #810
Comments
Sign up for free
to subscribe to this conversation on GitHub.
Already have an account?
Sign in.
Hi there,
I'm trying to draw a column series chart from a DataTable. The table is presented below.
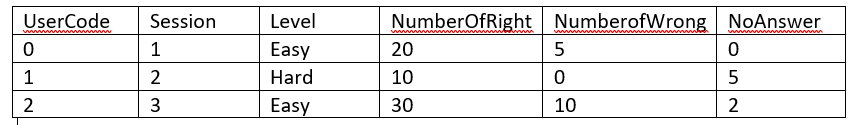
I would like to plot a chart with the number of right, wrong and no answer (example below) per session.
I tried to do the following:
SeriesCollectionBar = new SeriesCollection();
foreach (DataColumn column in performanceTable.Columns)
{
SeriesCollectionBar.Add(new ColumnSeries
{
Title = column.ColumnName,
Values = new ChartValues { 10, 50, 39, 50, 10, 70 }
}
But with no success.
I got the following:

Any help?
Thanks.
The text was updated successfully, but these errors were encountered: