polypoints
How to understand and convert points so they are usable. Polygon and Polylines can be treated the same, all that is different is polyline last set of points ends at the origin, where as with polygon we have to figure out how to get from the last point to the origin.
##The Map## This map is using 64x32 tiles on a 5x5 map
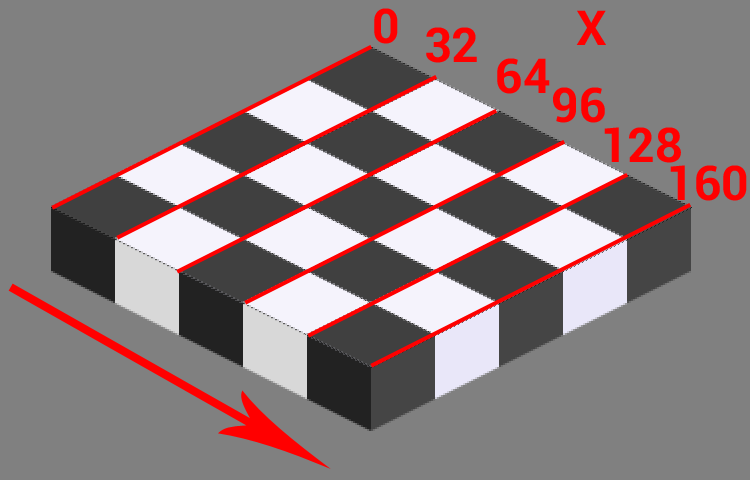
First understand the axis we're working on
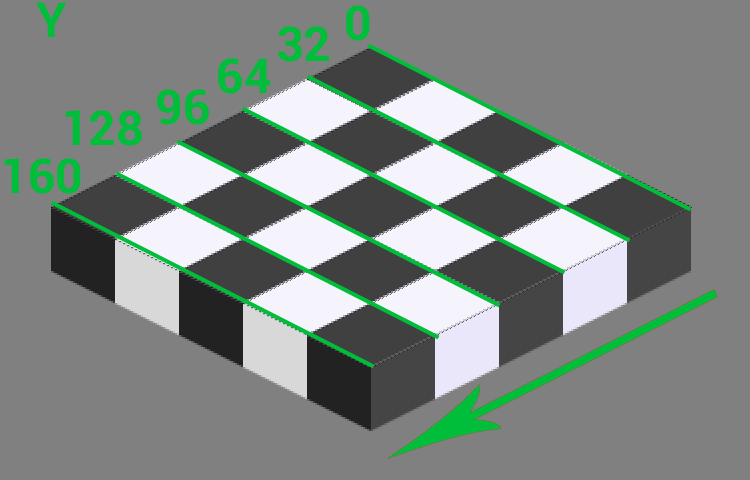
The right hand side of the map is the X axis, while the left hand side is the Y axis. And each row and column increase is an increase in 32 pixels. The following pictures will help you understand all the
The following shows you where 0,0 is on the map, this helps us plot where the X and Y really are. Since its 0,0 we don't have to worry, but if your map starts somewhere else you have to take this original map placement into consideration!
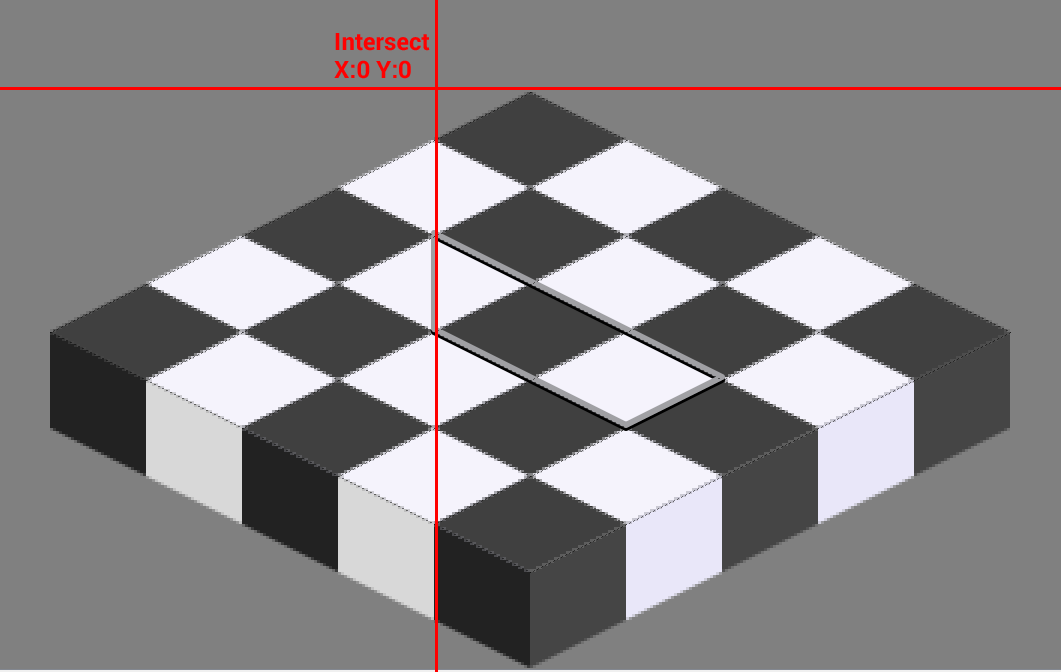
Also take in to account is we mostly divide by the tileheight, this is because TMX isometric map is 2:1 - The height is half the width.
##XML## Take the XML below from a polyline object
  <object x="32" y="64">
   <polyline points="0,0 96,0 96,32 32,32 0,0"/>
  </object>
##How to convert?## The object X and Y are the origin of this polyline. Its important to understand that from this origin point we add the pixels to get the point.
First we must plot it out just in a normal 2D manner.
- 0,0 means x:32 + 0 =32 Y:64 + 0 = 64
- 96,0 means x:32 + 96 = 128 Y: 64 + 0 = 64
- 96,32 means x:32 + 96 = 128 Y: 64 + 32 = 96
- 32,32 means x:32 + 32 = 64 Y: 64 + 32* = 96
So this means we've got the following shape built with the points
![]()
###2.pixelToTileCoordinate### Now we must run through the first stage of processing. X and Y values are from plotting out the pixel coordinates.
PTX = x / tileHeight
PTY = y / tileHeight
- (0,0) ploted = (32,64) run pixelToTileCoordinate it becomes (1.0000, 2.0000)
- (96,0) plotted = (128,64) run pixelToTileCoordinate it becomes (4.0000, 2.0000))
- (96,32) plotted = (128,96) run pixelToTileCoordinate it becomes (4.0000, 2.0000)
- (32,32) plotted = (64,96) run pixelToTileCoordinate it becomes ** (2.0000, 3.000)**
##3.tileToSceneCoordinate###
Now we must must run through the results of pixelToTileCoordinate through another calculation.
X = (PTX - PTY) * tileHeight
X += tileHeight
Y = (PTX + PTY) * (tileHeight /2)
Now you will see on X we add an extra tileHeight to the the calculation, this is because of the axis. If PTX = 1.0000 that is saying the point is in the first column, but 0 is a column so really 1 is the second column, so we add an extra tileheight (really its tileWidth /2) to the X to take this into account. I suppose you can remove this and increase 1.0000 to 2.0000 before this stage. Note: I suppose this is where you take into account your map drawing origin.
- (0,0) ploted = (32,64) becomes (1.0000, 2.0000) scene X Y (0.0000, 48.0000)
- (96,0) plotted = (128,64) becomes (4.0000, 2.0000) scene X Y (96.0000, 96.0000)
- (96,32) plotted = (128,96) becomes (4.0000, 2.0000) scene X Y (64.0000, 112.000)
- (32,32) plotted = (64,96) becomes (2.0000, 3.000) scene X Y (0.0000, 80.000)
##4.Done##
You now have scene coordinates!
##5. Rectange objects## You can do something very similar for normal rectangle objects.
With a rectangle you put the object X and Y into pixelToTileCoordinate. Then do the same with the size(width and height). Then plot out the rectangle in a 2D manner like we did before.
Then put each coordinate into tileToSceneCoordinate calculations.
##6.In Action##