Not analyzing #59
Comments
|
Hi @ahmetkizilkaya, the problem is that you are not getting any results on the dashboard is it ? |
|
@azharanees yes, there is no result on the dashboard.I tried different vulnerable applications too. |
|
@ahmetkizilkaya alright can i have a look at the full console log? |
|
@azharanees I sent all console log before. What do you need, I try to regenerate. |
|
@ahmetkizilkaya yeah please try regenerating the issue and if possible please send in the api logs |
Sign up for free
to join this conversation on GitHub.
Already have an account?
Sign in to comment
Hello
I try to scan an existing project but it can not analyze.
INFO: Load project settings for component key: '5cc5a81df8f52d06ad7a5298aeb5ea2b'
INFO: Load project settings for component key: '5cc5a81df8f52d06ad7a5298aeb5ea2b' (done) | time=82ms
INFO: Load quality profiles
INFO: Load quality profiles (done) | time=129ms
INFO: Load active rules
INFO: Load active rules (done) | time=2490ms
INFO: Indexing files...
INFO: Project configuration:
INFO: 1 file indexed
INFO: 0 files ignored because of scm ignore settings
INFO: ------------- Run sensors on module 5cc5a81df8f52d06ad7a5298aeb5ea2b
INFO: Load metrics repository
INFO: Load metrics repository (done) | time=49ms
INFO: Sensor JaCoCo XML Report Importer [jacoco]
INFO: Sensor JaCoCo XML Report Importer [jacoco] (done) | time=3ms
INFO: Sensor JavaXmlSensor [java]
INFO: Sensor JavaXmlSensor [java] (done) | time=1ms
INFO: Sensor HTML [web]
INFO: Sensor HTML [web] (done) | time=4ms
INFO: ------------- Run sensors on project
INFO: Sensor Zero Coverage Sensor
INFO: Sensor Zero Coverage Sensor (done) | time=2ms
INFO: CPD Executor Calculating CPD for 0 files
INFO: CPD Executor CPD calculation finished (done) | time=0ms
INFO: Analysis report generated in 684ms, dir size=74 KB
INFO: Analysis report compressed in 80ms, zip size=9 KB
INFO: Analysis report uploaded in 65ms
INFO: ANALYSIS SUCCESSFUL, you can browse http://localhost:9000/dashboard?id=5cc5a81df8f52d06ad7a5298aeb5ea2b
INFO: Note that you will be able to access the updated dashboard once the server has processed the submitted analysis report
INFO: More about the report processing at http://localhost:9000/api/ce/task?id=AXED3w4aSbhJgxCN4yPY
INFO: Analysis total time: 9.960 s
INFO: ------------------------------------------------------------------------
INFO: EXECUTION SUCCESS
INFO: ------------------------------------------------------------------------
INFO: Total time: 12.300s
INFO: Final Memory: 12M/44M
It seems passed at SonarQube
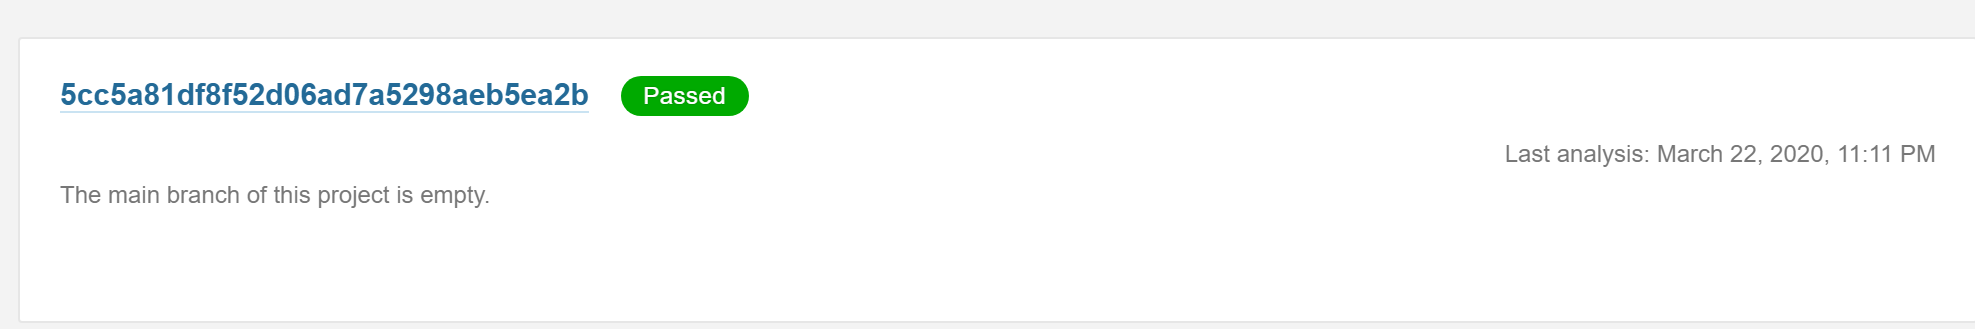
Language etc seems empty in SQL

The problem is i could scan it with SonarQube and it found some vulnerabilities.
What is wrong in my case?
Thank you for your help.
The text was updated successfully, but these errors were encountered: