Color coding stacked barplots by groups in R #42
Description
An issue I've been struggling with the past few days in R:
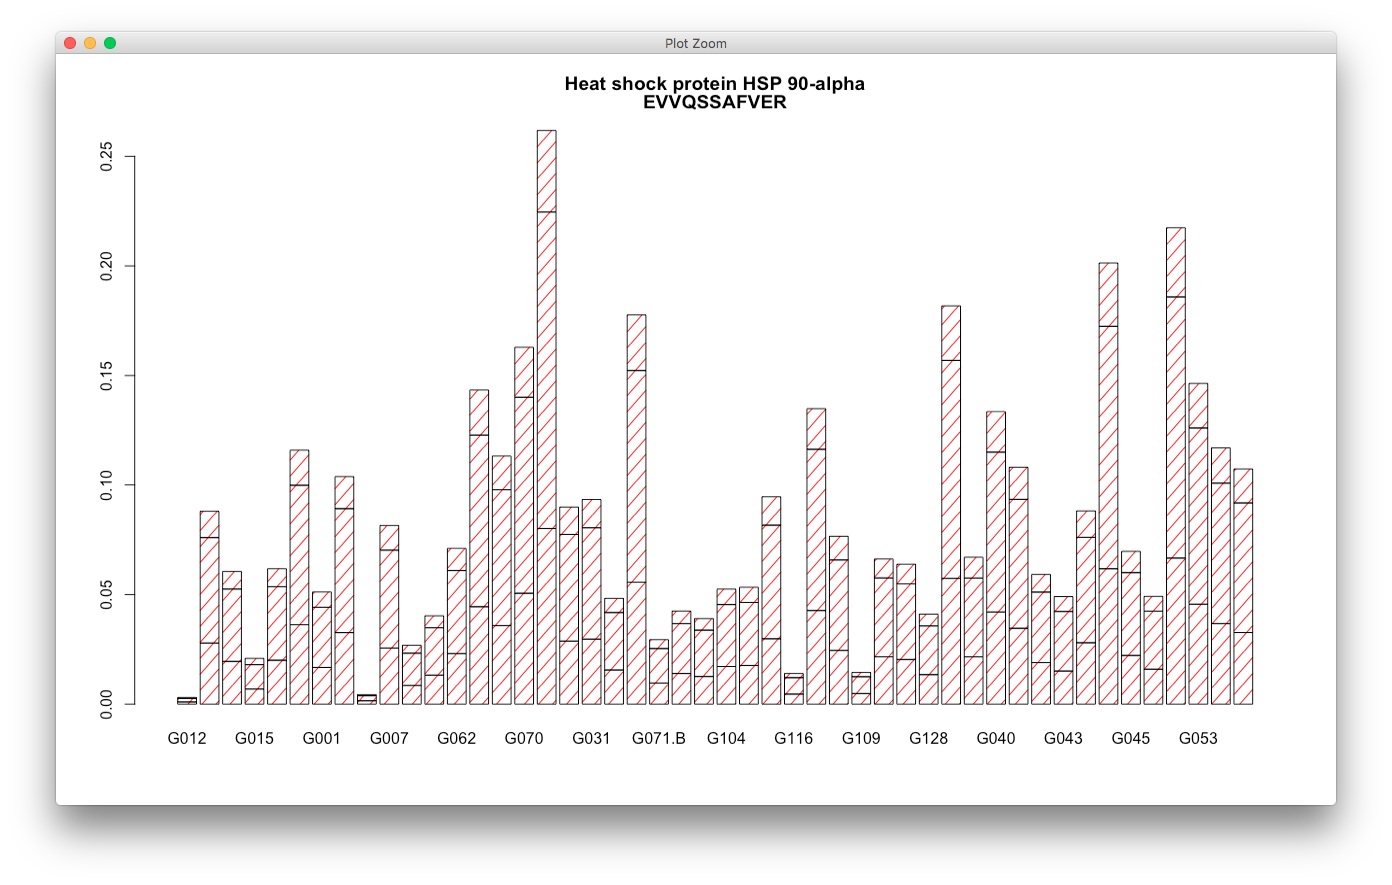
My goal is to create a barplot like this, but stacked so that each bar represents the sum of data in three rows of each column:

I can get a stacked barplot, but the color & pattern coding falls apart:
Here's dummy data and resulting bar plots to describe what's happening:
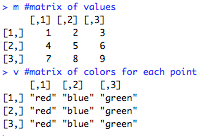
m = matrix(1:9, ncol = 3, byrow = TRUE)
v = matrix(c("red", "blue", "green"), ncol=3, nrow=3, byrow=TRUE)
m #matrix of values
v #matrix of colors for each point
plot row 1, designating colors correctly
barplot(m[1,], col=v[1,])

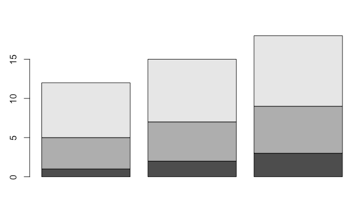
plot rows 1-3 stacked correctly
barplot(m[c(1:3),])
plot rows 1-3 with BESIDE=TRUE, color codes correctly
barplot(m[c(1:3),], col=v[c(1:3),], beside = TRUE)

plot rows 1-3, which stacks correctly, but color coding goes away.
barplot(m[c(1:3),], col=v[c(1:3),])
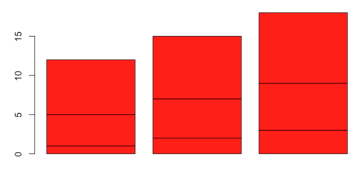
Any suggestions?