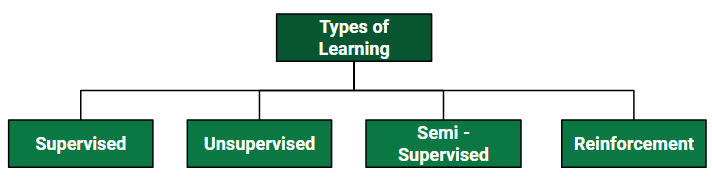
Machine Learning (ML)

Machine Learning is making the computer learn from studying data and statistics.
Machine Learning is a step into the direction of artificial intelligence (AI).
Machine Learning is a program that analyses data and learns to predict the outcome.
What is Supervised Machine Learning?
Supervised learning is a machine learning technique that is widely used in various fields such as finance, healthcare, marketing, and more. It is a form of machine learning in which the algorithm is trained on labeled data to make predictions or decisions based on the data inputs.In supervised learning, the algorithm learns a mapping between the input and output data. This mapping is learned from a labeled dataset, which consists of pairs of input and output data. The algorithm tries to learn the relationship between the input and output data so that it can make accurate predictions on new, unseen data.
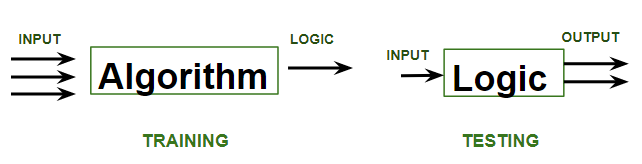
Supervised learning is where the model is trained on a labelled dataset. A labelled dataset is one that has both input and output parameters.
Types of Supervised Learning Algorithm Supervised learning is typically divided into two main categories: regression and classification. In regression, the algorithm learns to predict a continuous output value, such as the price of a house or the temperature of a city. In classification, the algorithm learns to predict a categorical output variable or class label, such as whether a customer is likely to purchase a product or not.
One of the primary advantages of supervised learning is that it allows for the creation of complex models that can make accurate predictions on new data. However, supervised learning requires large amounts of labeled training data to be effective. Additionally, the quality and representativeness of the training data can have a significant impact on the accuracy of the model. Supervised learning can be further classified into two categories:
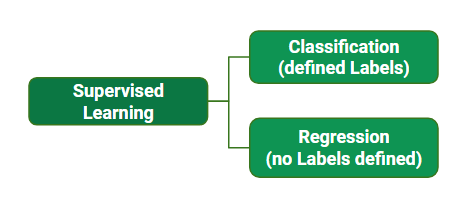
Regression Regression is a supervised learning technique used to predict continuous numerical values based on input features. It aims to establish a functional relationship between independent variables and a dependent variable, such as predicting house prices based on features like size, bedrooms, and location. The goal is to minimize the difference between predicted and actual values using algorithms like Linear Regression, Decision Trees, or Neural Networks, ensuring the model captures underlying patterns in the data.
Classification Classification is a type of supervised learning that categorizes input data into predefined labels. It involves training a model on labeled examples to learn patterns between input features and output classes. In classification, the target variable is a categorical value. For example, classifying emails as spam or not. The model’s goal is to generalize this learning to make accurate predictions on new, unseen data. Algorithms like Decision Trees, Support Vector Machines, and Neural Networks are commonly used for classification tasks. Supervised Machine Learning Algorithm Supervised learning can be further divided into several different types, each with its own unique characteristics and applications. Here are some of the most common types of supervised learning algorithms:
Linear Regression : Linear regression is a type of regression algorithm that is used to predict a continuous output value. It is one of the simplest and most widely used algorithms in supervised learning. In linear regression, the algorithm tries to find a linear relationship between the input features and the output value. The output value is predicted based on the weighted sum of the input features. Logistic Regression : Logistic regression is a type of classification algorithm that is used to predict a binary output variable. It is commonly used in machine learning applications where the output variable is either true or false, such as in fraud detection or spam filtering. In logistic regression, the algorithm tries to find a linear relationship between the input features and the output variable. The output variable is then transformed using a logistic function to produce a probability value between 0 and 1. Decision Trees : Decision tree is a tree-like structure that is used to model decisions and their possible consequences. Each internal node in the tree represents a decision, while each leaf node represents a possible outcome. Decision trees can be used to model complex relationships between input features and output variables. A decision tree is a type of algorithm that is used for both classification and regression tasks. Decision Trees Regression: Decision Trees can be utilized for regression tasks by predicting the value linked with a leaf node. Decision Trees Classification: Random Forest is a machine learning algorithm that uses multiple decision trees to improve classification and prevent overfitting. Random Forests : Random forests are made up of multiple decision trees that work together to make predictions. Each tree in the forest is trained on a different subset of the input features and data. The final prediction is made by aggregating the predictions of all the trees in the forest. Random forests are an ensemble learning technique that is used for both classification and regression tasks. Random Forest Regression : It combines multiple decision trees to reduce overfitting and improve prediction accuracy. Random Forest Classifier: Combines several decision trees to improve the accuracy of classification while minimizing overfitting. Support Vector Machine(SVM) : The SVM algorithm creates a hyperplane to segregate n-dimensional space into classes and identify the correct category of new data points. The extreme cases that help create the hyperplane are called support vectors, hence the name Support Vector Machine. A Support Vector Machine is a type of algorithm that is used for both classification and regression tasks Support Vector Regression: It is a extension of Support Vector Machines (SVM) used for predicting continuous values. Support Vector Classifier: It aims to find the best hyperplane that maximizes the margin between data points of different classes. K-Nearest Neighbors (KNN) : KNN works by finding k training examples closest to a given input and then predicts the class or value based on the majority class or average value of these neighbors. The performance of KNN can be influenced by the choice of k and the distance metric used to measure proximity. However, it is intuitive but can be sensitive to noisy data and requires careful selection of k for optimal results. A K-Nearest Neighbors (KNN) is a type of algorithm that is used for both classification and regression tasks. K-Nearest Neighbors Regressio n: It predicts continuous values by averaging the outputs of the k closest neighbors. K-Nearest Neighbors Classification: Data points are classified based on the majority class of their k closest neighbors. Gradient Boosting : Gradient Boosting combines weak learners, like decision trees, to create a strong model. It iteratively builds new models that correct errors made by previous ones. Each new model is trained to minimize residual errors, resulting in a powerful predictor capable of handling complex data relationships. A Gradient Boosting is a type of algorithm that is used for both classification and regression tasks. Gradient Boosting Regression: It builds an ensemble of weak learners to improve prediction accuracy through iterative training. Gradient Boosting Classification: Creates a group of classifiers to continually enhance the accuracy of predictions through iterations Dimensions of Supervised Machine Learning Algorithm When discussing the dimensions of supervised machine learning algorithms, we refer to various aspects that characterize and influence the performance, complexity, and applicability of these algorithms. These dimensions provide a framework for understanding how an algorithm operates, its strengths and weaknesses, and how it can be optimized for specific tasks. Here’s an explanation of key dimensions:
-
Complexity Model Complexity: This refers to the intricacy of the algorithm’s structure. Simple models like linear regression are easy to understand and interpret, but they may not capture complex relationships in data. On the other hand, more complex models like deep neural networks can capture intricate patterns but are harder to interpret and require more computational resources. Overfitting and Underfitting: Complexity is closely tied to overfitting (where the model learns the noise in the training data) and underfitting (where the model is too simple to capture the underlying pattern). Balancing complexity is crucial for creating a model that generalizes well to unseen data.
-
Interpretability Transparency: Some algorithms, like decision trees, are highly interpretable, meaning their decision-making process can be easily understood by humans. Other algorithms, like neural networks, operate as “black boxes,” where the reasoning behind a prediction is not easily discernible. Feature Importance: In interpretability, understanding which features (input variables) are most influential in making predictions is important. This can be straightforward in algorithms like linear regression, where coefficients directly indicate feature importance, but more challenging in complex models like ensemble methods or neural networks.
-
Scalability Data Size: Scalability refers to the algorithm’s ability to handle large datasets. Some algorithms, like K-Nearest Neighbors (KNN) , may become computationally expensive as the dataset grows, while others, like linear models or decision trees, can scale more efficiently with large datasets. Dimensionality: Scalability also considers how well an algorithm performs as the number of features (dimensions) increases. High-dimensional data can lead to challenges like the “curse of dimensionality,” where the data becomes sparse, and distance measures (used in algorithms like KNN) become less meaningful.
-
Flexibility Adaptability to Different Data Types: Flexibility indicates how well an algorithm can be adapted to different types of data (e.g., categorical, continuous, or mixed data types). Some algorithms are inherently more flexible, like decision trees , which can handle both categorical and continuous data. Handling Missing Data: Flexibility also involves how well an algorithm can handle incomplete data. Some algorithms can naturally handle missing values, while others may require data imputation or other preprocessing steps.
-
Training Time and Computational Efficiency Algorithm Efficiency: This dimension measures the time and computational resources required to train the model. Algorithms like linear regression or Naive Bayes are generally fast to train, while more complex models like support vector machines (SVM) or neural networks might require significant computational power and time, especially on large datasets. Resource Requirements: The efficiency of an algorithm also depends on the hardware and software environment. Some algorithms can be parallelized to speed up training, while others may be limited by memory or processing power. Training a Model for Supervised Learning Training a model for supervised learning involves several crucial steps, each designed to prepare the model to make accurate predictions or decisions based on labeled data. Below is a detailed explanation of the process:
-
Data Collection and Preprocessing Data Collection: The first step is gathering the data that will be used to train the model. In supervised learning, this data must be labeled, meaning that each data point should have corresponding input features and an associated output label (the correct answer). Data Preprocessing: Raw data often contains noise, missing values, or irrelevant features. Preprocessing involves cleaning the data, handling missing values, normalizing or scaling the data, and selecting the most relevant features. This step is critical because the quality of the input data directly impacts the model’s performance.
-
Splitting the Data Training and Testing Split: The dataset is typically split into two parts: the training set and the testing set. A common split ratio is 80:20, where 80% of the data is used for training the model, and 20% is reserved for testing. The training set is used to teach the model, while the testing set is used to evaluate its performance on unseen data. Validation Set (Optional): Sometimes, the training data is further split into a training set and a validation set. The validation set is used to fine-tune the model parameters during training without exposing the model to the testing set.
-
Choosing the Model Algorithm Selection: Depending on the type of problem (regression or classification), an appropriate supervised learning algorithm is selected. Common algorithms include: Linear Regression for predicting continuous values. Logistic Regression for binary classification tasks. Decision Trees for both regression and classification. Support Vector Machines (SVM) for classification and regression. Random Forests and Gradient Boosting Machines (GBM) for ensemble learning. Model Initialization: The model is initialized with default parameters, or initial parameters are set based on prior knowledge or experiments.
-
Training the Model Feeding Data: The training data (input features and output labels) is fed into the model. The model uses this data to learn patterns and relationships between the inputs and outputs. Learning Process: The model adjusts its internal parameters (e.g., weights in a linear model or node decisions in a tree) to minimize the difference between its predictions and the actual output labels. This process is often guided by a loss function (e.g., Mean Squared Error for regression, Cross-Entropy Loss for classification) that quantifies the error. Optimization: The model uses an optimization algorithm, such as Gradient Descent , to iteratively update its parameters and reduce the loss. This step is repeated for multiple iterations, or epochs, until the model’s performance stabilizes.
-
Evaluating the Model Testing: Once the model is trained, it is evaluated on the testing set. The input features from the testing set are fed into the model, which predicts the outputs. These predicted outputs are then compared to the actual labels to assess the model’s accuracy. Performance Metrics: Several metrics are used to evaluate the model’s performance: Accuracy: The proportion of correct predictions. Precision, Recall, and F1-Score: Metrics used in classification tasks to evaluate the model’s ability to correctly identify positive instances. Mean Squared Error (MSE): A common metric for regression tasks to measure the average squared difference between predicted and actual values. Confusion Matrix: A table used in classification to visualize the performance of the model across different classes.
-
Hyperparameter Tuning Hyperparameter Optimization: Hyperparameters are model parameters set before training (e.g., the learning rate in gradient descent, the number of trees in a random forest). Tuning these hyperparameters can significantly impact the model’s performance. Techniques like Grid Search or Random Search are commonly used to find the best hyperparameter values. Cross-Validation: To ensure that the model generalizes well to new data, cross-validation is often used. This involves dividing the training data into several subsets and training the model multiple times, each time using a different subset as the validation set. The results are averaged to provide a more robust evaluation.
-
Final Model Selection and Testing Final Training: After hyperparameter tuning, the model is retrained on the entire training set (including the validation set, if used) using the best-found hyperparameters. Final Testing: The model is then tested on the testing set to evaluate its final performance. This step determines how well the model is likely to perform on real-world, unseen data.
-
Model Deployment Deployment: Once the model has been thoroughly tested and validated, it is ready to be deployed into a production environment where it can make predictions on new, unseen data. Monitoring: Post-deployment, the model’s performance should be continuously monitored to ensure it continues to perform well. Over time, the model may need to be retrained with new data to adapt to changes in the underlying patterns.
-
Iterative Improvement Feedback Loop: In practice, model training is an iterative process. Based on the performance metrics and feedback, the model may need to be refined or retrained with more data, different features, or alternative algorithms to achieve better results. By following these steps, a supervised learning model can be effectively trained to make accurate predictions, whether it’s classifying emails as spam or not, predicting house prices, or any other task that requires mapping inputs to outputs based on labeled data.
A dvantages of Supervised Learning The power of supervised learning lies in its ability to accurately predict patterns and make data-driven decisions across a variety of applications. Here are some advantages listed below:
Labeled training data benefits supervised learning by enabling models to accurately learn patterns and relationships between inputs and outputs. Supervised learning models can accurately predict and classify new data. Supervised learning has a wide range of applications, including classification, regression, and even more complex problems like image recognition and natural language processing. Well-established evaluation metrics, including accuracy, precision, recall, and F1-score, facilitate the assessment of supervised learning model performance. Disadvantages of Supervised Learning Although supervised learning methods have benefits, their limitations require careful consideration during problem formulation, data collection, model selection, and evaluation. Here are some disadvantages listed below:
Overfitting : Models can overfit training data, which leads to poor performance on new, unseen data due to the capture of noise. Feature Engineering : Extracting relevant features from raw data is crucial for model performance, but this process can be time-consuming and may require domain expertise. Bias in Models: Training data biases can lead to unfair predictions. Supervised learning heavily depends on labeled training data, which can be costly, time-consuming, and may require domain expertise. Conclusion In summary, supervised learning is a powerful machine learning technique that relies on labeled data to train models for making accurate predictions. While it offers significant advantages in various applications, such as classification and regression, it also comes with challenges like overfitting and the need for extensive feature engineering. By understanding the key dimensions of supervised learning algorithms and following a structured approach to model training, practitioners can harness its potential to build robust, data-driven solutions across diverse domains.