Grafana Table doesn't merge queries results with Victoria Metrics datasource #720
Comments
|
Hi @Keiske! Could you pls check the actual response in both cases and compare? Would be nice to post it here if possible. |
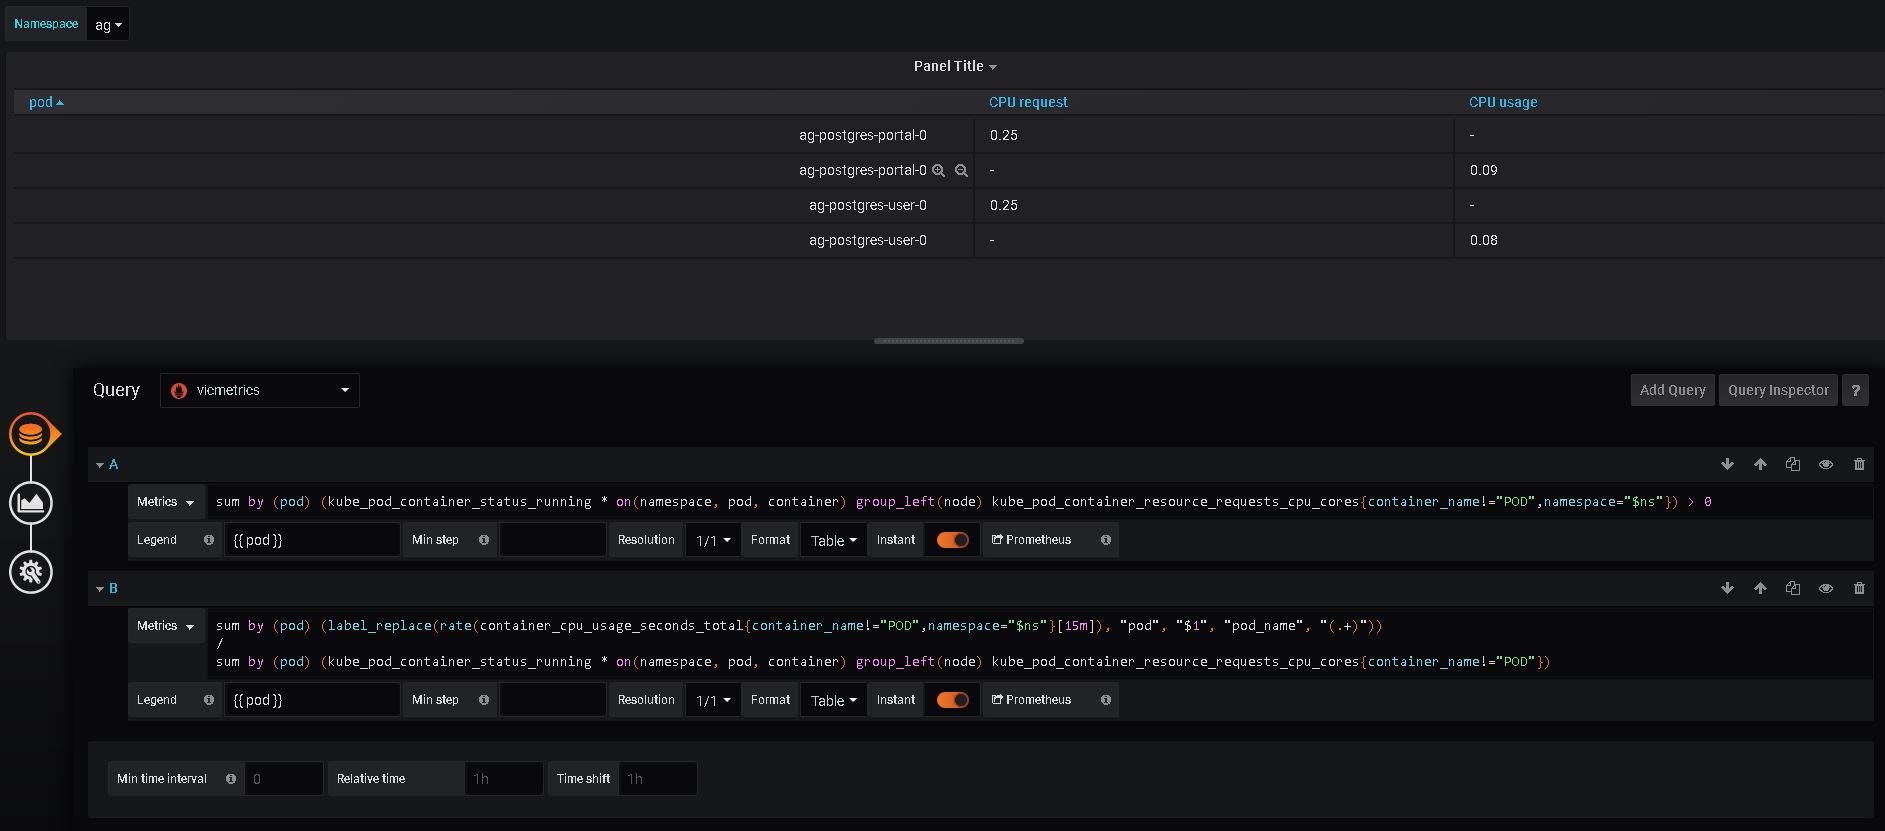
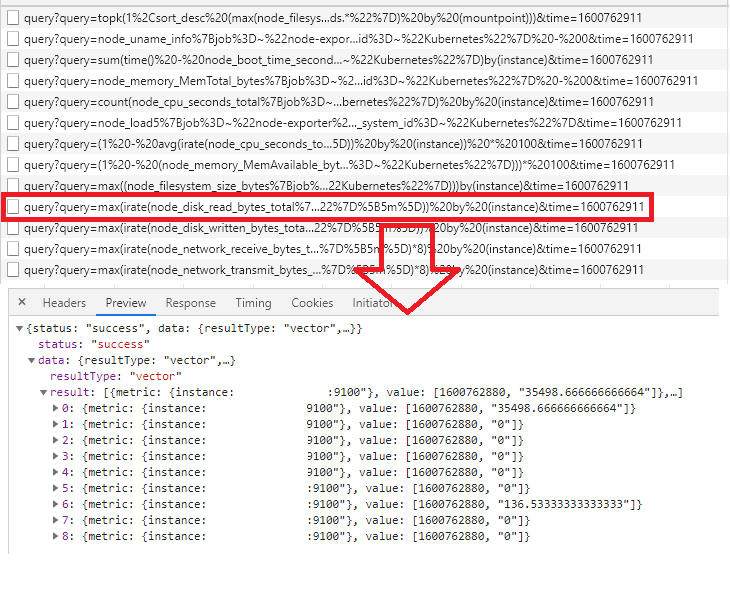
Sure. Here it is. Looks very similar, but with switched order of metrics in results. First value column query result: VictoriaMetrics: Second value column query results: VictoriaMetrics:
|
|
Thanks! Weird, content looks identical except order. But order is consistent for both VM requests so it shouldn't be a case. Have you tried to build any other tables based on VM datasource? I wonder if it is Grafana bug... |
|
@Keiske , try wrapping queries into |
|
Hi!I have same question.My environment uses v1.40.0-cluster.
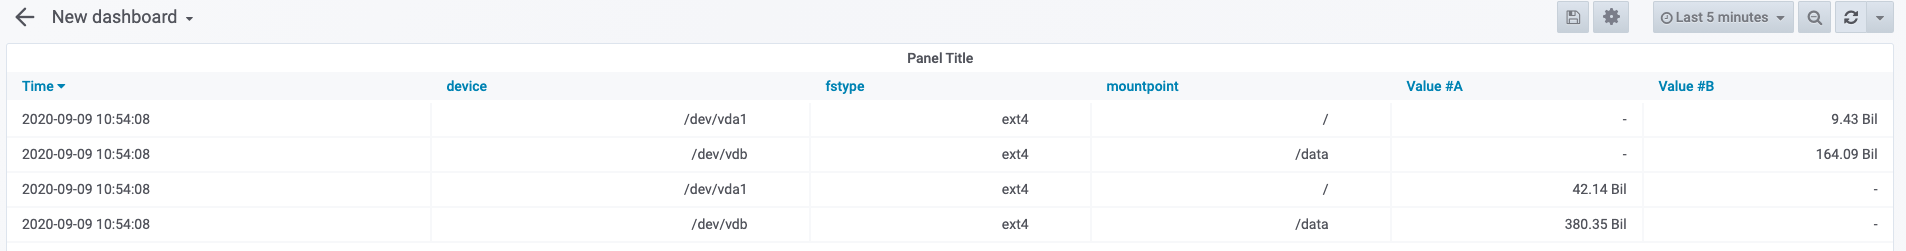
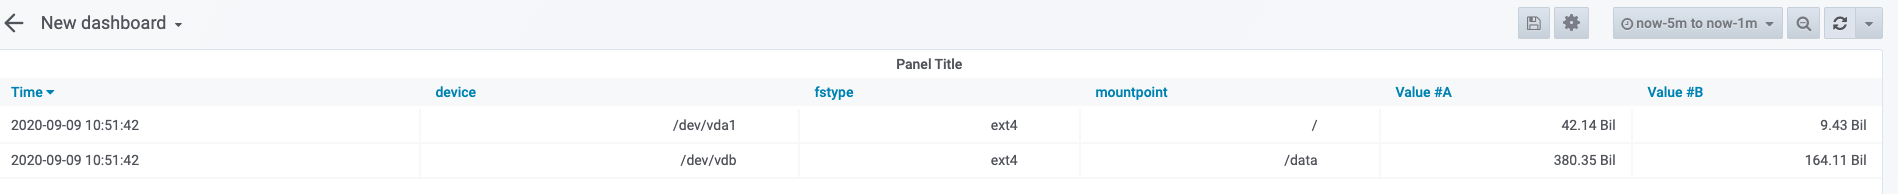
But I change grafana time range is ok(from now-5m to now-1m),my prometheus scrape_interval is 1m.
When i use v1.37.2-cluster is ok |
|
Hi @balabalazhoucj! Have you tried to set |
|
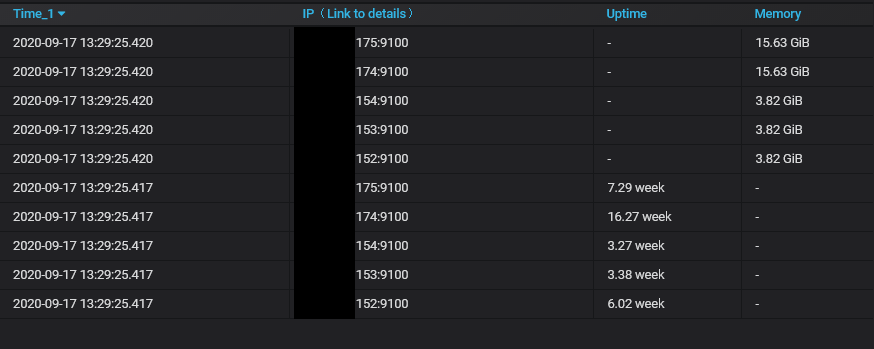
@hagen1778 I think its because when "instant" is used it returns time for as - 30s (or current value of search.latencyOffset param set for vmselect) instead of actual time for this metric. And because queries may complete in different time this timestamps may differ for 1-2-10-inf ms, and it breaks the table. |
|
@valyala Sorting results didn't help. @hagen1778 Yes, as @Muxa1L said, our issue looks just like this. Refreshing dashboard in browser sometimes makes table marge correct. About 1 of 10 page refreshes. But how can we fix it to always merge results in table correctly, just like Prometheus datasource does. |
|
By the way, when you disable "instant" thus running ranged query - last results of query are correct. |
|
@hagen1778 I think it will be better to return the timestamp of the last metric value Plus. If VM would round timestamps up to seconds - it still will be possible to get different timestamps that will break the table. |
|
@hagen1778
|

|
@hagen1778 Nvm my previous comment. Returning timestamps with seconds precision will be enough. Prometheus also returns with seconds precision. And victoriaMetrics returned timestamps with seconds precision before v1.39.0, as @starsliao noticed |
|
The issue must be fixed in the following commits: The bugfix rounds default |
|
@valyala grafana passes time to queries. But it does not seem to be counted anywhere. I think this part overwrites start value. VictoriaMetrics/app/vmselect/prometheus/prometheus.go Lines 654 to 658 in 3b1e3a0 So setting -search.latencyOffset to something small, like 1ms helps. |
…h match the `time` query arg

Updates #720
…h match the `time` query arg

Updates #720
|
@valyala, great! Now it works correctly, thanks for fixes! |
|
Is it advised to use rollback to v1.38.1? Is this fix going to to be released soon? |
Unfortunately it is impossible to downgrade from v1.41.* to older releases due to on-disk data format change. See release notes for v1.41.0 for details. So it is better waiting for the next release or building VictoriaMetrics from sources according to the following docs:
The fix will be included in the upcoming release, which is going to be published in the next couple of days. |
|
The bugfix is available starting from v1.42.0. Closing the bug as fixed. |
Describe the bug
Switching datasource from Prometheus to Victoria Metrics in Grafana Tables breaks row merging for the same data. We are trying to use VictoriaMetrics as long-term historical metrics storage for our Kubernetes in-cluster Prometheus. Have configured Prometheus to send data to VictoriaMetrics via remote_write api.
To Reproduce
Expected behavior
Multiple queries results with same lebels should be merged to rows in Grafana Tables panel.
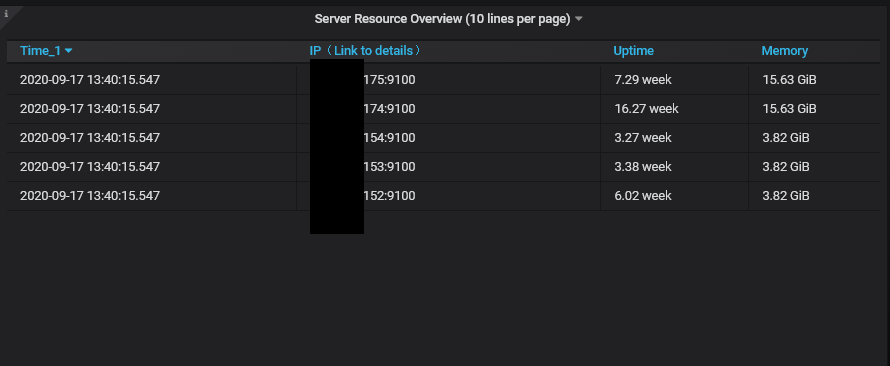
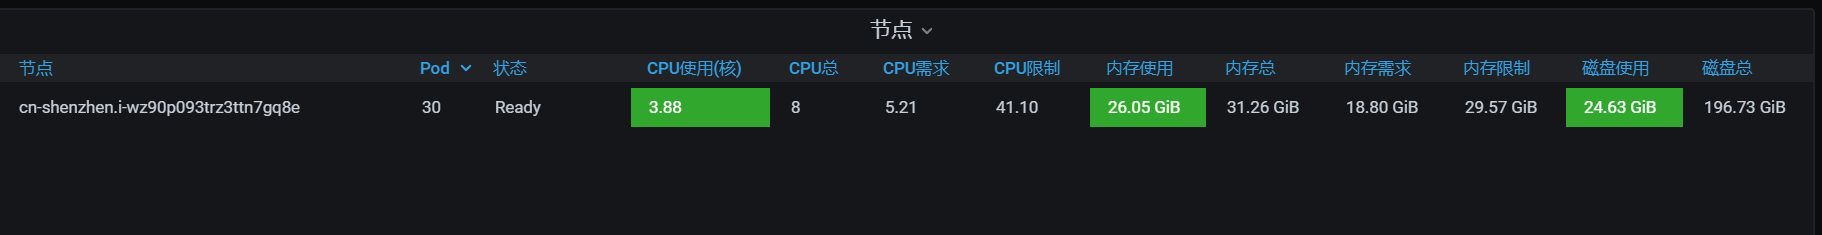
Screenshots

Prometheus datasource table result:
VictoriaMetrics datasource table result with same queries and settings:

Version
The line returned when passing
--versioncommand line flag to binary. For example:The text was updated successfully, but these errors were encountered: