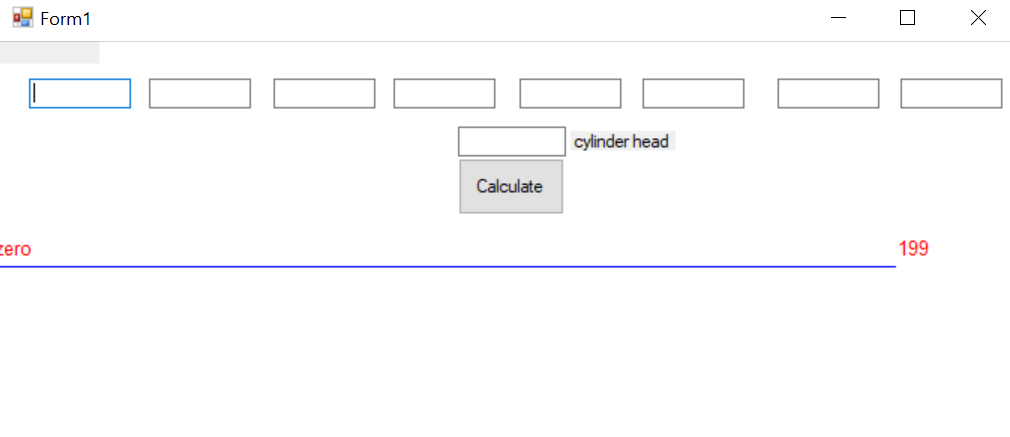
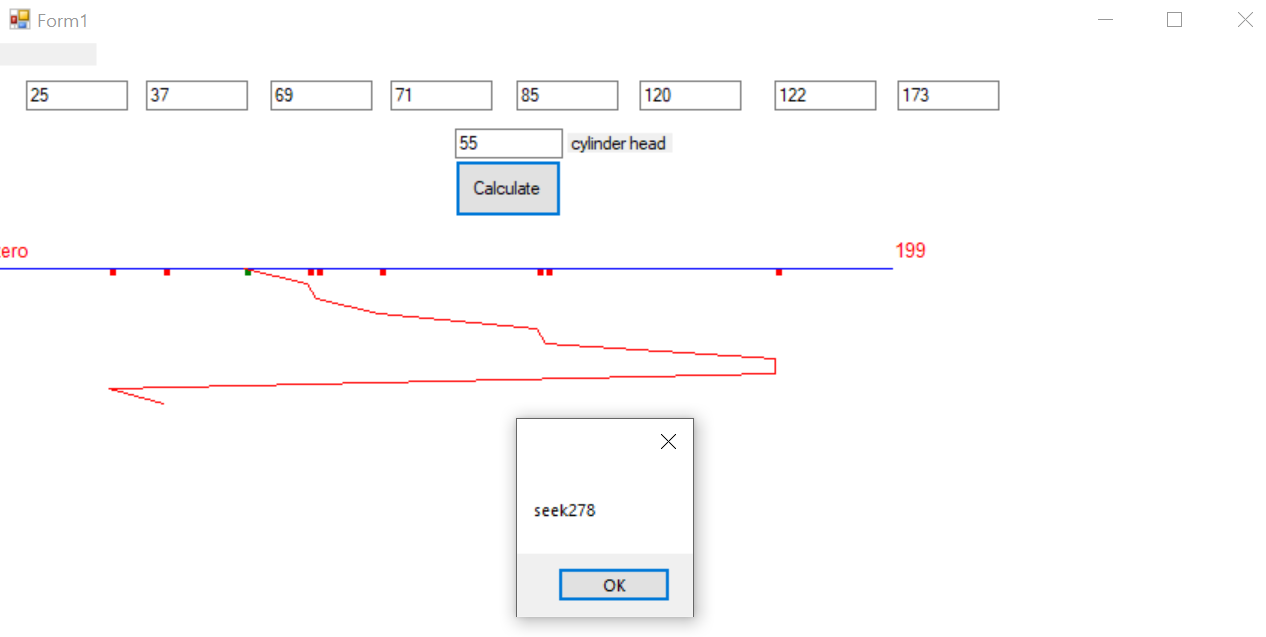
Implementation: Users should fill all the text boxes with numbers that should be between 0 and 199 below that represent the requests and the last one which is the cylinder head the finally click calculate.
When the user clicks calculate he will see the requests on the graph each one represented as a red ellipse and the cylinder head as a green ellipse click on the message boxes to see each line moving from each request to another and the calculated seek in the textbox.