Integration with geopandas geometries #588
Comments
|
That's a really interesting idea... I've not done much work with geopandas, so I'm not certain what it would take. |
|
Also interested in this. |
|
Would this be as simple as wrapping |
|
I have no idea what it would entail... I'm not familiar enough with GeoJSON or GeoPandas, or what geo formats are supported in Vega-Lite. |
|
from vega-lite's website I think integration with GeoPandas would be a great addition to |
|
Got it working :) Load two datasetscounties = r'/Users/mattijnvanhoek/Desktop/us-10m.json'
unemp_data = r'/Users/mattijnvanhoek/Desktop/unemployment.tsv'df = pd.read_csv(unemp_data, sep='\t')
# make sure you have Fiona <= 1.8a2 or >= 1.8.5
# since the versions in between did not include the `TopoJSON` driver
gdf = gpd.read_file(counties, driver='TopoJSON')
gdf.id = gdf.id.astype(int)Apply inner-join on GeoDataFrame and DataFrame (
|

| geometry | id | rate | |
|---|---|---|---|
| 0 | () | 22051 | .065 |
| 1 | (POLYGON ((-90.1077214366575 30.19168413151698... | 22051 | .065 |
| 2 | (POLYGON ((-120.8536146368232 49.0001146177235... | 53073 | .078 |
| 3 | POLYGON ((-106.1123837970986 48.99904031068445... | 30105 | .046 |
| 4 | POLYGON ((-114.0698488011574 48.99904031068445... | 30029 | .088 |
Prepare GeoDataFrame for Altair
# dump as json
json_gdf = gdf_merged.to_json()
# load as a GeoJSON object.
json_features = json.loads(json_gdf)
Make the Choropleth Map
# parse variable `features` from json_features to `alt.Data`
data_geo = alt.Data(values=json_features['features'])

# plot map, where variables ares nested within `properties`,
alt.Chart(data_geo).mark_geoshape(
    fill='lightgray',
    stroke='white'
).properties(
    projection={'type': 'albersUsa'},
    width=700,
    height=400
).encode(
    color='properties.rate:Q')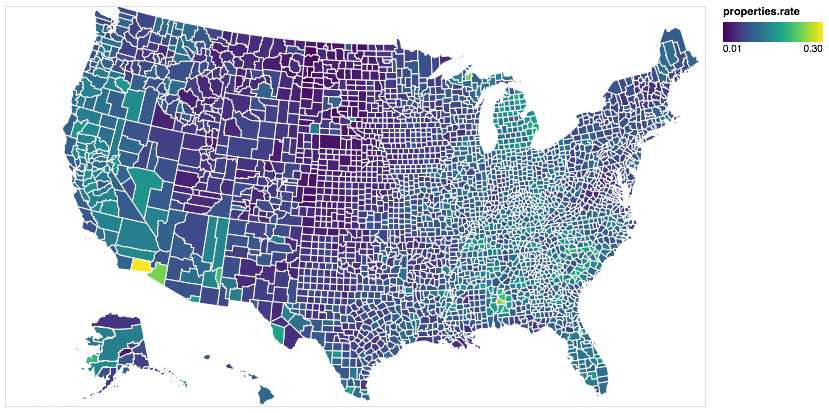
👍
# download file and read into variables
us_10m = vega_datasets.data.us_10m()
unemp_data = vega_datasets.data.unemployment()

# the original unemp_data has two columns merged, need to split them
unemp_data['id'], unemp_data['rate'] = unemp_data['id\trate'].str.split('\t', 1).str

# key: convert whatever variables to altair-recognizable format by using alt.Data()
# note we need to specify the format and feed it with alt.SomeKindDataFormat()
# we need to specify feature or mesh to extract TopoJSON, the type can only be 'topojson'
counties = alt.Data(
    values=us_10m,
    format=alt.TopoDataFormat(feature='counties',type='topojson')
)

# plot by lookup
# same as the example in (https://altair-viz.github.io/user_guide/transform.html#lookup-transform
alt.Chart(counties).mark_geoshape().encode(
    color='rate:Q'
).properties(
    projection={'type': 'albersUsa'},
    width=500, height=300
).transform_lookup(
    lookup='id',
    from_=alt.LookupData(unemp_data, 'id', ['rate'])
)
|
|
No the file is the same, but I had downloaded the file to disk first, before reading. To use import altair as alt
import geopandas as gpd
import pandas as pd
import json
# extra
from vega_datasets import data
import requests
import fiona
%matplotlib inline# load the tab separated unemployment file into a DataFrame
df = pd.read_csv(data.unemployment.url, sep='\t')# parse the us_10m topojson file into memory
request = requests.get(data.us_10m.url)
visz = fiona.ogrext.buffer_to_virtual_file(bytes(request.content))
# read the features from a fiona collection into a GeoDataFrame
with fiona.Collection(visz, driver='TopoJSON') as f:
gdf = gpd.GeoDataFrame.from_features(f, crs=f.crs)# continue as above
gdf.id = gdf.id.astype(int)
gdf_merged = gdf.merge(df, left_on='id', right_on='id', how='inner')
gdf_merged.head()
Continue from step |
|
Would it make sense to build some of that data preparation into vega_datasets? |
|
Yes, if the result is a |
|
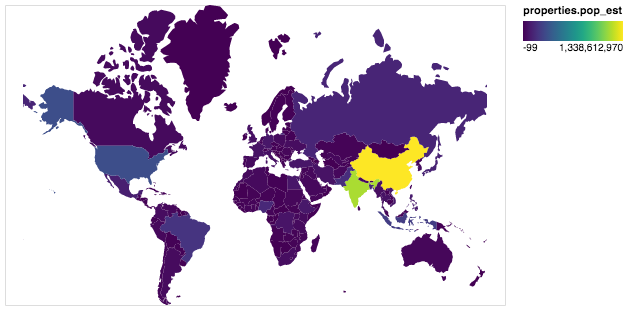
I think it's little bit simpler import altair as alt
import pandas as pd
import geopandas as gpd
alt.renderers.enable('notebook')
world = gpd.read_file(gpd.datasets.get_path('naturalearth_lowres'))
world = world[world.continent!='Antarctica'] # do not display Antarctica
data = alt.InlineData(values = world.to_json(), #geopandas to geojson string
# root object type is "FeatureCollection" but we need its features
format = alt.DataFormat(property='features',type='json'))
alt.Chart(data).mark_geoshape(
).encode(
color='properties.pop_est:Q', # DataFrame fields are accessible through a "properties" object
tooltip='properties.name:N'
).properties(
projection={"type":'mercator'},
width=500,
height=300
)
But it will crush if we add Timestamp type field to DataFrame. To to avoid crashing it could be sanitized by In general case will be great to support any object with geo_interface that is widely supported by python GIS libraries. I suggest to have a special class for this case something like: |
That would be great! |
# Conflicts:
#	altair/__init__.py
#	doc/conf.py
#	doc/getting_started/installation.rst
#	setup.py
…pandas

# Conflicts:
#	altair/utils/data.py
…pandas

# Conflicts:
#	altair/utils/data.py
|
To avoid static dependencies between Altair and GeoPandas I have published |
|
For what it's worth, I installed My taste would be for tighter integration rather than yet-another-library, but I recognize that I'm not trying to maintain a rapidly evolving library in a rapidly evolving ecosystem. If it won't be integrated, at least a reference in the altair docs would be great. |
|
I agree – sorry this has been so slow, but getting it more tightly integrated depends on a redesign of the data_transformer architecture that hasn't happened yet. |
|
sure, i totally understand... just wanted to verify that it's solid |
I would like to give a +1 to that. While it surely is a good idea to use geopandas if you are into pandas-like analysis, it is a big dependency. Supporting geo interface would allow users to stay with light-weight things like Fiona and Shapely for the geo analyses. |
|
To be honest, I don't know much about geographic data and the libraries that support them. This is not going to be solved until someone with more expertise digs in and figures out a good approach. |
|
Isn't this stalled because of #887? |
|
No, that has to do with supporting geopandas as a data transformer. I'm not totally convinced that's the best route (for example, it would be pretty confusing if your geo charts stopped working when you enabled I think it would be better to support geo data (be it geopandas, shapely, fiona, etc.) natively as part of the Altair API, but I'm not familiar enough with geo viz libraries to have good ideas on how to do that. |
|
This issue is fixed by #1664 🌍! |
|
Does anyone know why this does not work with states? When the us10m file is read in with geopandas, why do the state ids not copy over? |
|
It works for me ( import geopandas as gpd
import altair as alt
gdf = gpd.read_file(
'https://raw.githubusercontent.com/vega/vega/master/docs/data/us-10m.json',
driver='TopoJSON'
)
alt.Chart(gdf).mark_geoshape().encode(color='id:Q').project('albersUsa')
|

geopandasis a package that reads many type of geometric datasets, including geojson, topojson and shapefiles (albeit throughfiona) and parses it into apandasdataframe, where thegeometryis parsed as a separate column.It would be great if this is
geometrytype is recognized in Altair to make a map easily.Problems might arise with projections as Vega doesn’t support all EPSG projections, but EPSG:4326 equals to Mercator and that is supported.
The text was updated successfully, but these errors were encountered: