- About
- Usage
- Example
- Parameters
- Known issues or bugs
- Roadmap and upcoming features
- External resources used
Bar-Gen is a bar chart creation program that converts your data into attractive charts. Simple to use with many customizable features.
NOTE: This library requires jQuery.
Add bar-gen.js and bar-gen.css to your project folder.
Include them and a link to jQuery in your index page.
<head>
  <!-- Load bar-gen CSS -->
  <link rel="stylesheet" href="bar-gen.css">
</head>
<body>
  <!-- Don't forget to load jQuery -->
  <script src="https://code.jquery.com/jquery-3.3.1.js"></script>
  <!-- Load bar-gen script -->
  <script src="bar-gen.js"></script>
</body>
Make sure to load jQuery and the bar-gen files before your own custom css and js files.
Call the bar chart generator using the drawBarChart function:
drawBarChart(data, options, element);data- A nested array of values including the labels for the x-axis.
options- An object containing the various customizable aspects of the bar chart including chart title, font colors, axis colors, etc.
element- A DOM or jQuery element that the chart will be rendered into.
var data = [
  [ 10, "Monday" ],
  [ 14, "Tuesday" ],
  [ 12, "Wednesday" ],
  [ 19, "Thursday" ],
  [ 11, "Friday" ]
];
var options = {
  width: 500,
  height: 300,
  labelColor: "darkMagenta",
  yAxisTicks: [ 0, 5, 10, 15, 20 ],
  chartTitle: "Employees Who Showed Up For Work",
  titleFontSize: 24,
  spacerWidth: 3
};
drawBarChart(data, options, $("#barchart"));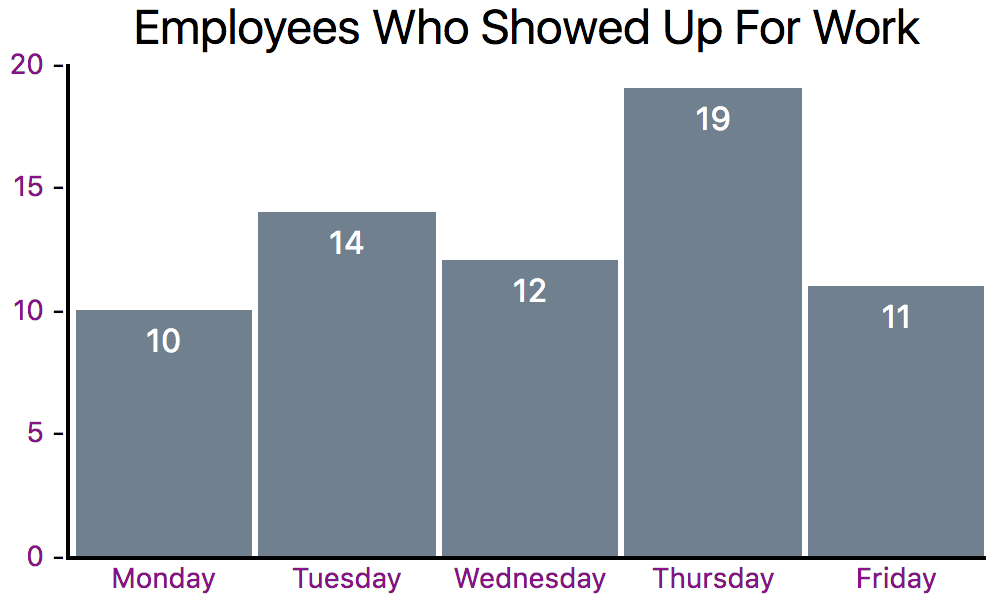
The data parameter must be a nested array containing the data for the chart as well as the labels for the x-axis. For example:
var data = [
  [ 10, "Monday" ],
  [ 14, "Tuesday" ],
  [ 12, "Wednesday" ],
  [ 19, "Thursday" ],
  [ 11, "Friday" ]
];
Ensure that the first element in the nested array is the data value and the second is the x-axis label.
Bar-Gen has quite a few customizable options. Use the options object to pass these values into the function. All of the following customization options except width and height are optional.
| Parameter | Optional | Summary | Default |
|---|---|---|---|
axisBorderWidth |
Yes | The width or thickness (in pixels) of the axes. | 2 |
axisColor |
Yes | The color of the x and y axes. | "black" |
barColors |
Yes | An array containing colors for the bar elements. If the number of colors in barColors is less than the total number of data points passed in, then the colors will repeat in the order they are stated. |
[ "slateGrey" ] |
chartTitle |
Yes | The title that appears above the rendered chart. | "Chart" |
fontColor |
Yes | The font color for the values that are displayed on the bar elements. | "white" |
height |
No | The total height (in pixels) of the element that the bar chart will be rendered into. The chart will not exceed this overall height. The minimum height is 100. | N/A |
labelColor |
Yes | The color of the axes' labels. | "black" |
showAnimation |
Yes | Show an animation when the chart is rendered. | false |
showTooltips |
Yes | A boolean value to display or hide tooltips for the chart. | false |
spacerWidth |
Yes | The space (in pixels) between each bar element. | 2 |
titleFontColor |
Yes | The color of the title text. | "black" |
titleFontSize |
Yes | The font size (in pixels) of the title. | 24 |
valuePosition |
Yes | The position within the bar element where the value will be displayed. Choices are top, center, or bottom. |
"top" |
width |
No | The total width (in pixels) of the element that the bar chart will be rendered into. The chart will not exceed this overall width and the width of the individual bar elements will be based on this value. | N/A |
xAxisHeight |
Yes | The height (in pixels) of the x-axis. | 20 |
yAxisTicks |
Yes | An array showing where the ticks on the y-axis should be located. The y-axis will render to the larger of either the largest value in the yAxisTicks array or the largest value in the dataArray array. |
Generated based on 0, 20, 40, 60, 80, and 100% of the largest data value |
yAxisWidth |
Yes | The width (in pixels) of the y-axis. | 40 |
This is the element that the chart will be rendered into. Bar-Gen accepts an element selected via javascript's document.getElementById("chart") or jQuery's $("#chart").
- Does not show negative values
- Generate stacked bar charts
- Handle negative values
- Specify non-zero starting point for y-axis
- Generate horizontal bar charts
- Generate grouped bar charts
- Generate horizontal stacked bar charts
- Adapted HTML5 blank template with jQuery from this gist
- Discovered alternative to 'with' statement (assign object 'path' to a temporary variable) on MDN
- Experimented with creating rectangles using W3 Schools' try it feature
- Experimented turning rectangles into bar charts using jsfiddle
- Learned about inline-block elements and whitespace in this answer on stack overflow
- Found HTML5 color names on c-sharpcorner.com
- Practiced relative and absolute positioning to display values at specific places within bar at W3 Schools
- Experimented with tooltips at W3 Schools
- Practiced using markdown to create README file using Dillinger markdown previewer and StackEdit markdown previewer
- Calculated y-axis tick vertical adjustment amount by plotting points on a graph at mycurvefit.com
- Used code from this stack overflow answer to override default Bootstrap box-sizing
- Practiced jQuery animations on W3 Schools
- Learned how to hide and show elements using jQuery from a stack overflow answer
- Demoed form controls in Bootstrap's documentation
- Learned about JSON.stringify on MDN