Skip to content
New issue

Have a question about this project? Sign up for a free GitHub account to open an issue and contact its maintainers and the community.

By clicking “Sign up for GitHub”, you agree to our terms of service and privacy statement. We’ll occasionally send you account related emails.

Already on GitHub? Sign in to your account

Fluentd daemonset doesn’t generate logs as standard output #5618

Closed
kishorkk91 opened this issue Feb 25, 2021 · 7 comments
Closed

Fluentd daemonset doesn’t generate logs as standard output #5618

kishorkk91 opened this issue Feb 25, 2021 · 7 comments

Comments

@kishorkk91
Copy link

kishorkk91 commented Feb 25, 2021

I have deployed the EFK helm chart on the K8s cluster. All pod runs fine but Fluentd not showing any logs and consequently not on Kibana either. I don't know if I have something missing in the config or the Bitnami issue itself. The cluster is restricted, and don't know if that makes any difference. Firstly, pods were not up so I deployed as a non-root user and ** pspEnabled: true** then pods were running fine.
image

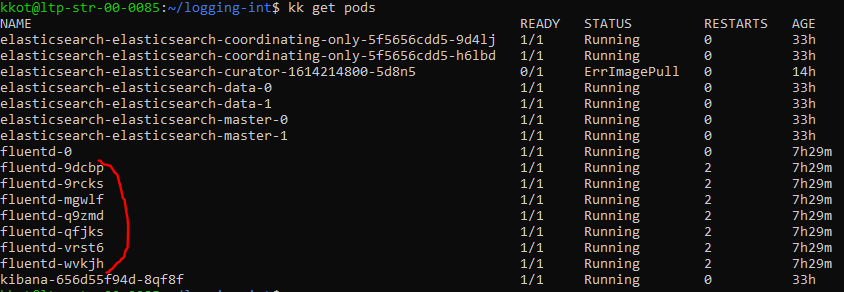
None of the daemonset is generating the logs.
However, I deployed the same EFK stack on the unrestricted cluster with the default config, and works totally fine and logstash is seen on Kibana
Using following versions fo EFK which are released this week earlier:
bitnamielasticsearch:7.10.2-debian-10-r10
bitnamifluentd:1.12.1-debian-10-r0
bitnami/kibana:7.10.2-debian-10-r11

values.yaml

forwarder:
  enabled: true
  daemonUser: fluentd
  daemonGroup: fluentd
  securityContext:
    enabled: true
    runAsUser: 1001
    runAsGroup: 1001
    fsGroup: 1001
  # Updated: not using own configMap
  configMap: apache-log-parser
  extraEnv: 
  - name: FLUENTD_DAEMON_USER
    value: fluentd
  - name: FLUENTD_DAEMON_GROUP
    value: fluentd
2021-02-25 15:39:23 +0000 [warn]: #0 /var/log/containers/admin-client-68fd7fd976-jm6lq_sgkb-r200-test_admin-client-9b37186468d118447f00b4849fecf38e7a016cefdf3cf7babc0d34a31b3bad76.log unreadable. It is excluded and would be examined next time.
2021-02-25 15:39:23 +0000 [warn]: #0 /var/log/containers/identityserver-oauth-56d88cdf48-kfdsf_soba-r200-test_identityserver-oauth-3fd2d70b2acb233fd88f8e3efc3fffce4b5ce7b836d0c33b2da472fbcfa4e163.log unreadable. It is excluded and would be examined next time.
2021-02-25 15:39:23 +0000 [warn]: #0 /var/log/containers/nginx-ingress-controller-q76ck_ingress-nginx_nginx-ingress-controller-55d592bb7feec07405356302b386a172183edbe4b6177900e23efc72f37e3387.log unreadable. It is excluded and would be examined next time.
2021-02-25 15:39:27.565840924 +0000 fluentd.healthcheck: {"ping":"pong"}
2021-02-25 15:39:31.938308903 +0000 fluentd.healthcheck: {"ping":"pong"}
2021-02-25 15:39:37.565580905 +0000 fluentd.healthcheck: {"ping":"pong"}

Is there any way to fix it? let me know if additional info requires.
Your support will be really appreciated.
Thanks in advance.

@Mauraza
Copy link
Member

Mauraza commented Feb 26, 2021

Hi @kishorkk91,

Did you check this issue #4813? I think could be related.

@kishorkk91
Copy link
Author

Hello @Mauraza ,
Thanks for the feedback. Yes, I am following #4813

@kishorkk91
Copy link
Author

kishorkk91 commented Feb 28, 2021

I am using version 3.6.2 of fluentd and I have used the default ConfigMapFiles for forwarder and aggregator from values.yaml. After so many trials and errors I am able to see some logs but unfortunately since the year 1970.01.01 and of course in kibana I see logstash logs from 1970.01.01
I have the same date issue on all 3 clusters of mine!!

kkot@ltp-str-00-0085:~/logging-int$ kubectl logs -l "app.kubernetes.io/component=aggregator"
1970-01-01 00:33:41.267229471 +0000 kubernetes.var.log.containers.payscan-56f94ddbcd-5fgqz_sgkb-r200-test_payscan-6a123dce39ade96b45ac156b69ea08f1bbc63382840782937dbeee8978d0f4dc.log: {"log":"\tat com.zaxxer.hikari.pool.PoolBase.newPoolEntry(PoolBase.java:194) ~[HikariCP-2.7.9.jar!/:?]\n","stream":"stdout","docker":{"container_id":"6a123dce39ade96b45ac156b69ea08f1bbc63382840782937dbeee8978d0f4dc"},"kubernetes":{"container_name":"payscan","namespace_name":"sgkb-r200-test")

If I EXEC in of the fluentd container then DATE seems OK to me.

kkot@ltp-str-00-0085:~/logging-int$ kk exec -it fluentd-9kdp4 -- bash
root@fluentd-9kdp4:/opt/bitnami/fluentd# date
Mon Mar  1 07:20:20 UTC 2021

Is there a way to fix this strange date error?

@Mauraza
Copy link
Member

Mauraza commented Mar 2, 2021

Hi @kishorkk91,

We have this guide https://docs.bitnami.com/tutorials/integrate-logging-kubernetes-kibana-elasticsearch-fluentd
You new to create two configMap that appears in step 3
I hope that helps you.

@kishorkk91
Copy link
Author

kishorkk91 commented Mar 2, 2021

Hi @Mauraza ,
Yes, I am already referring to it and thanks for the link.
just a question: Do I have to still include "configFile: fluentd.conf" file in values.yaml even if I am creating the configmaps by myself?

  ## Name of the config file that will be used by Fluentd at launch
  ## Fluentd will look for it under the /opt/bitnami/fluentd/conf directory
  ##
  configFile: fluentd.conf

  ## Name of the configMap that contains the configuration files for fluentd
  ## If not specified, one will be created by default
  ##
  # configMap:

@Mauraza
Copy link
Member

Mauraza commented Mar 2, 2021

Hi @kishorkk91,

This value configFile: fluentd.conf is the name of the config file that will be used by Fluentd at launch under the /opt/bitnami/fluentd/conf directory, if you follow the guide you don't have to include is that value because it is the default value.

@kishorkk91
Copy link
Author

Hi @Mauraza ,
Thanks for the valuable and useful feedback and finally I am able to see some logs from logstash on Kibana.

image

Sign up for free to join this conversation on GitHub. Already have an account? Sign in to comment
Labels
None yet
Projects
None yet
Development

No branches or pull requests

2 participants