Software version info
OS: Linux 5.6.0-2-amd64 #1 SMP Debian 5.6.14-2 (2020-06-09) x86_64 GNU/Linux
Bokeh version: 2.2.2
Python version: 3.8.6
Description of expected behavior and the observed behavior
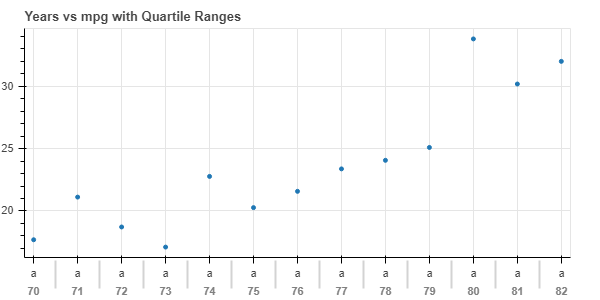
I used to be able to combine whiskers into categorical plots using Bokeh 1.4.0. When I upgraded to 2.2.2, the whiskers disappeared. The plot I have in mind is a dotplot + whiskers + multi-category plot, with the (single) dot indicating the mean and whiskers as stderr.
Complete, minimal, self-contained example code that reproduces the issue
(this code is lightly edited from https://docs.bokeh.org/en/latest/docs/user_guide/annotations.html?highlight=whisker, and incorporates some categorical code (e.g. x_range=FactorRange(*x)) from https://docs.bokeh.org/en/latest/docs/user_guide/categorical.html.
from bokeh.models import ColumnDataSource, Whisker, FactorRange
from bokeh.plotting import output_file, figure, show, save
from bokeh.sampledata.autompg import autompg as df

output_file('whiskers.html')

colors = ["red", "olive", "darkred", "goldenrod", "skyblue", "orange", "salmon"]

base, lower, upper, mpg = [], [], [], []

for i, year in enumerate(list(df.yr.unique())):
    year_mpgs = df[df['yr'] == year]['mpg']
    mpgs_mean = year_mpgs.mean()
    mpgs_std = year_mpgs.std()
    lower.append(mpgs_mean - mpgs_std)
    upper.append(mpgs_mean + mpgs_std)
    mpg.append(mpgs_mean)
    #base.append(str(year))
    base.append((str(year), 'a'))

#p = figure(plot_width=600, plot_height=300, title="Years vs mpg with Quartile Ranges")
p = figure(x_range=FactorRange(*base), plot_width=600, plot_height=300, title="Years vs mpg with Quartile Ranges")
source_error = ColumnDataSource(data=dict(base=base, lower=lower, upper=upper, mpg=mpg))
p.scatter(x='base', y='mpg', source=source_error)

p.add_layout(
    Whisker(source=source_error, base="base", upper="upper", lower="lower")
)

save(p)
Stack traceback and/or browser JavaScript console output
Screenshots or screencasts of the bug in action
When the code is run as provided above, this is what I got.
When the commented statements are uncommented (i.e. #base.append(str(year)) and #p = figure(plot_width=600, plot_height=300, title="Years vs mpg with Quartile Ranges")), and the line following that is commented out, I get

Not exactly sure what's wrong, but it seems to me that Whisker seem to only appear on numerical-type axis, not a factorial-type one? Thanks for looking into this!
Software version info
OS: Linux 5.6.0-2-amd64 #1 SMP Debian 5.6.14-2 (2020-06-09) x86_64 GNU/Linux
Bokeh version: 2.2.2
Python version: 3.8.6
Description of expected behavior and the observed behavior
I used to be able to combine whiskers into categorical plots using Bokeh 1.4.0. When I upgraded to 2.2.2, the whiskers disappeared. The plot I have in mind is a dotplot + whiskers + multi-category plot, with the (single) dot indicating the mean and whiskers as stderr.
Complete, minimal, self-contained example code that reproduces the issue
(this code is lightly edited from https://docs.bokeh.org/en/latest/docs/user_guide/annotations.html?highlight=whisker, and incorporates some categorical code (e.g.
x_range=FactorRange(*x)) from https://docs.bokeh.org/en/latest/docs/user_guide/categorical.html.Stack traceback and/or browser JavaScript console output
Screenshots or screencasts of the bug in action
When the code is run as provided above, this is what I got.

When the commented statements are uncommented (i.e.

#base.append(str(year))and#p = figure(plot_width=600, plot_height=300, title="Years vs mpg with Quartile Ranges")), and the line following that is commented out, I getNot exactly sure what's wrong, but it seems to me that
Whiskerseem to only appear on numerical-type axis, not a factorial-type one? Thanks for looking into this!