Skip to content

[BUG] dropdown menu is hidden in multi choice, others are not #11365

Closed

Description

@quynhpn97

Untitled Diagram

Activity

  1. changed the title [-][BUG] dropdown menu is hidden in multi choice [/-] [+][BUG] dropdown menu is hidden in multi choice, others are not[/+] on Jun 20, 2021
  2. mattpap commented on Jun 22, 2021

    @mattpap
    Contributor

    @quynhpn97, which version of bokeh do you use? Similar issue was fixed in 2.3.0 (PR #10695).

  3. quynhpn97 commented on Jun 23, 2021

    @quynhpn97
    Author

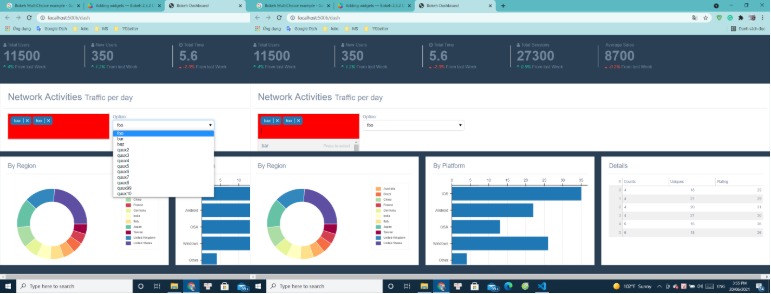
    @mattpap thank for replying, I use version 2.3.2 Bokeh. When I insert multichoice widget into tag row in html, dropdowm menu is hidden by widgets in next row.

  4. quynhpn97 commented on Jun 23, 2021

    @quynhpn97
    Author

    My solution is adding style for tag row, specifically style="z-index: 1; position:relative".

    Hope it helps someone in need!

  5. bryevdv commented on Jun 23, 2021

    @bryevdv
    Member

    Reopening, this needs a proper solution.

  6. bryevdv commented on Jun 23, 2021

    @bryevdv
    Member

    @quynhpn97 please provide a complete script that reproduces this issue so that we can investigate fully.

  7. quynhpn97 commented on Jun 23, 2021

    @quynhpn97
    Author

    @bryevdv I argee.

  8. bryevdv commented on Jun 24, 2021

    @bryevdv
    Member

    @quynhpn97 will you be able to provide a complete Minimal Reproducible Example with instructions/steps to reproduce? If not we will have to close this after all, with norepro

  9. added this to the 2.3.3 milestone on Jun 24, 2021
  10. mattpap commented on Jun 24, 2021

    @mattpap
    Contributor

    Menu is being obscured when additional roots are present (e.g. custom templates are being used). This has been a common problem, given that z-index is relative to roots, so following roots obscure content of previous roots, even with set z-index.

  11. quynhpn97 commented on Jun 25, 2021

    @quynhpn97
    Author

    @bryevdv

    main.py

    from collections import Counter
    from math import pi
    import pandas as pd
    from bokeh.io import curdoc
    from bokeh.models import (ColumnDataSource, DataTable, NumberFormatter,
                              RangeTool, StringFormatter, TableColumn)
    from bokeh.palettes import Spectral11
    from bokeh.plotting import figure
    from bokeh.sampledata.autompg2 import autompg2 as mpg
    from bokeh.transform import cumsum
    from bokeh.models import CustomJS, MultiChoice, Select
    from bokeh.layouts import column, row, layout, gridplot
    OPTIONS = ["foo", "bar", "baz", "quux4", "quux5", "quux6", "quux7", "quux8", "quux9", "quux10"]
    
    multi_choice = MultiChoice(value=["foo", "baz"], options=OPTIONS)  #css_classes = ['bk-btn-default']
    glyphs = ["line", "scatter"]
    select = Select(title = "Select plot:", value = "", options = [""] + glyphs)
    curdoc().add_root(row(multi_choice, select, align = 'center', height=200, name='choice'))
    x = Counter({ 'United States': 157, 'United Kingdom': 93, 'Japan': 89, 'China': 63,
                  'Germany': 44, 'India': 42, 'Italy': 40, 'Australia': 35, 'Brazil': 32,
                  'France': 31, 'Taiwan': 31  })
    
    data = pd.DataFrame.from_dict(dict(x), orient='index').reset_index().rename(index=str, columns={0:'value', 'index':'country'})
    data['angle'] = data['value']/sum(x.values()) * 2*pi
    data['color'] = Spectral11
    
    region = figure(height=350, toolbar_location=None, outline_line_color=None, sizing_mode="scale_both", name="region", x_range=(-0.4, 1))
    
    region.annular_wedge(x=-0, y=1, inner_radius=0.2, outer_radius=0.32,
                      start_angle=cumsum('angle', include_zero=True), end_angle=cumsum('angle'),
                      line_color="white", fill_color='color', legend_group='country', source=data)
    
    region.axis.axis_label=None
    region.axis.visible=False
    region.grid.grid_line_color = None
    region.legend.label_text_font_size = "0.7em"
    region.legend.spacing = 1
    region.legend.glyph_height = 15
    region.legend.label_height = 15
    
    curdoc().add_root(region)
    # Bar chart
    
    plats = ("IOS", "Android", "OSX", "Windows", "Other")
    values = (35, 22, 13, 26, 4)
    platform = figure(height=350, toolbar_location=None, outline_line_color=None, sizing_mode="scale_both", name="platform",
                      y_range=list(reversed(plats)), x_axis_location="above")
    platform.x_range.start = 0
    platform.ygrid.grid_line_color = None
    platform.axis.minor_tick_line_color = None
    platform.outline_line_color = None
    
    platform.hbar(left=0, right=values, y=plats, height=0.8)
    
    curdoc().add_root(platform)
    
    # Table
    
    source = ColumnDataSource(data=mpg[:6])
    columns = [
        TableColumn(field="cyl", title="Counts"),
        TableColumn(field="cty", title="Uniques",
                    formatter=StringFormatter(text_align="center")),
        TableColumn(field="hwy", title="Rating",
                    formatter=NumberFormatter(text_align="right")),
    ]
    table = DataTable(source=source, columns=columns, height=210, width=330, name="table", sizing_mode="scale_both")
    
    curdoc().add_root(table)
    

    templates/index.html

    {% extends base %}
    {% block preamble %}
    
      <!-- Bootstrap -->
      <link rel="stylesheet" href="https://maxcdn.bootstrapcdn.com/bootstrap/3.3.7/css/bootstrap.min.css">
      <!-- Font Awesome -->
      <link rel="stylesheet" href="https://maxcdn.bootstrapcdn.com/font-awesome/4.7.0/css/font-awesome.min.css">
      <!-- Custom Style -->
      <link href="dash/static/css/custom.min.css" rel="stylesheet">
      <!-- <link href="dash/static/css/style.css" rel="stylesheet"> -->
    
    {% endblock %}
    
    {% block contents %}
    
    <div class="container body">
      <div class="main_container">
    
    
        <!-- page content -->
        <div class="right_col" role="main">
          <div class="row">
    
              <div class="col-md-12 col-sm-12 col-xs-12">
                <!-- <div class="x_panel tile fixed_height_390 overflow_hidden"> -->
                  <div class="row x_title">
                    <div class="col-md-6">
                      <h3>Network Activities <small>Traffic per day</small></h3>
                    </div>
                  </div>
                  {{ embed(roots.choice) }}
                <!-- </div> -->
              </div>
    
          </div>
    
          <div class="row">
    
            <div class="col-md-4 col-sm-4 col-xs-12">
              <div class="x_panel tile fixed_height_320 overflow_hidden">
                <div class="x_title">
                  <h2>By Region</h2>
                  <div class="clearfix"></div>
                </div>
                {{ embed(roots.region) }}
              </div>
            </div>
    
            <div class="col-md-4 col-sm-4 col-xs-12">
              <div class="x_panel tile fixed_height_320 overflow_hidden">
                <div class="x_title">
                  <h2>By Platform</h2>
                  <div class="clearfix"></div>
                </div>
                {{ embed(roots.platform) }}
              </div>
            </div>
    
    
            <div class="col-md-4 col-sm-4 col-xs-12">
              <div class="x_panel tile fixed_height_320 overflow_hidden">
                <div class="x_title">
                  <h2>Details</h2>
                  <div class="clearfix"></div>
                </div>
                {{ embed(roots.table) }}
              </div>
            </div>
    
          </div>
    
        </div>
    
      </div>
    </div>
    <!-- /page content -->
    
    {% endblock %}


    I add <div class="row" style="z-index: 1; position:relative"> for row-tag include {{ embed(roots.choice) }}

  12. github-actions commented on Oct 26, 2024

    @github-actions

    This issue has been automatically locked since there has not been any recent activity after it was closed. Please open a new issue for related bugs.

  13. locked as resolved and limited conversation to collaborators on Oct 26, 2024
  14. added theissue type on Jul 23, 2026
Sign up for free to join this conversation on GitHub. Already have an account? Sign in to comment

Metadata

Metadata

Assignees

No one assigned

    Type

    Projects

    No projects

      Milestone

      Relationships

      None yet

      Development

      No branches or pull requests

      Issue actions