DataTable does not display the last row #8630
Comments
|
This could maybe be fixed by allowing the user to scroll vertically past the last row, like another 5 or 10 rows of height... |
|
@mitchm17 Thank you for the report. In order to work an issue, we really must have a complete minimal test case submitted to work against. Please update the issue when you have a chance. Additionally, it is possible that #8085 already fixed this, can you test against dev build 1.1dev2 or later? https://bokeh.pydata.org/en/latest/docs/installation.html#developer-builds |
|
My code uses another script, and the main.py script is over 400 lines, do you want me to include all of that? Or I can attach the files, would that be better? I'll test this agains the newest dev build. Do you know how to get the newest build in anaconda? |
|
@mitchm17 Dev builds are only published to a specific conda channel, not defaults. Installation instructions for dev builds are in the link above, or are you asking something different? Regarding the code, in the ideal case it's possible to create a minimal example that just has enough code to demonstrate the issue and nothing else (or pare down some other code to that point). If that's not possible then a link to the code is next best, but in general the simpler and easier it is to reproduce an issue, the higher the chance it will be gotten to sooner. |
|
Sorry, I missed that you included that link. I followed the installation instructions above, using the conda install -c bokeh/channel/dev bokeh command, ran my code again and it is still the same issue. It now says bokeh version is still 1.0.2 I hope the following is a complete minimal example... |
Hrm, it should say |
|
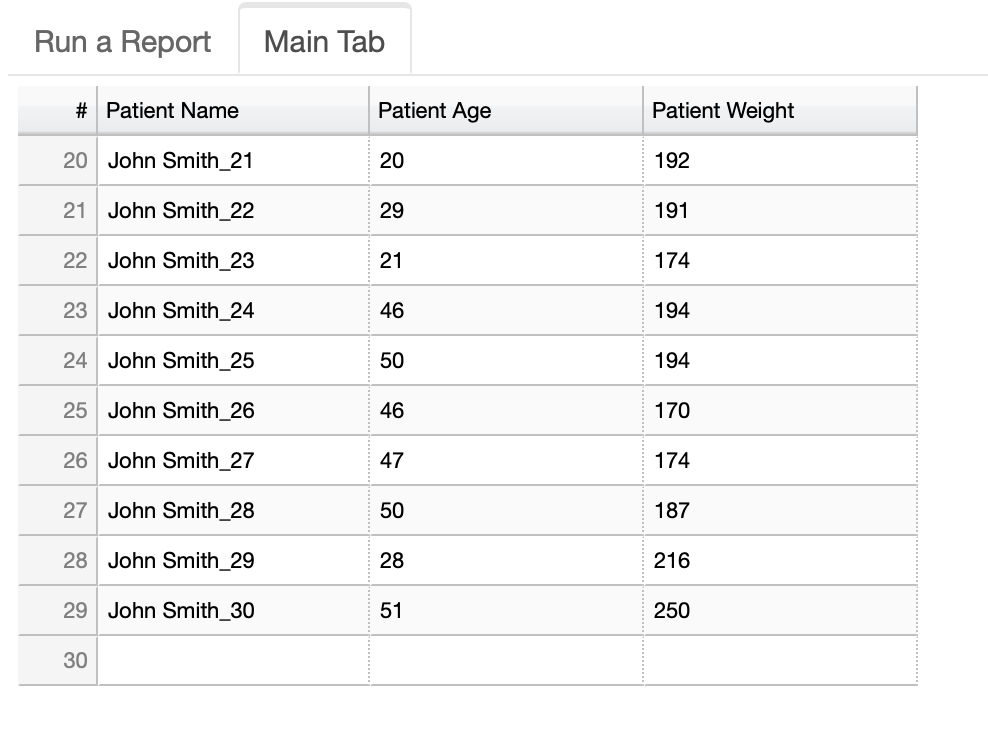
@mitchm17 this is how things look on
Just to be sure the last row should be blank, I also printed the data:
so the blank fields appear to represent whats actually in the data. So I am going to go ahead and close this, you should see the fix in the next release. If you are still seeing an issue after 1.1. comes out, we can revisit/re-open |
|
Okay sounds good! Glad it is working with the new build! Thank you @bryevdv ! |
|
Hey @bryevdv , there seems to be a new problem with 1.1.dev2 After I run a report summary, the data table titles seem to get hidden. Also, when you look at the Main Tab tab, after the report is run, the two buttons that were in the layout above the data table are now shrunk in width size and are now hidden for the most part. Let me know what you think... Here's what it looks like when the buttons shrink and the data table covers them up:
|

|
@bryevdv cool. Is there a way I can revert back to 1.0.4 in the meantime? Does 1.1 have a release date yet? |
hopefully in the next two weeks |
|
@bryevdv great, thanks. I'll keep a look out! |
bokeh: 1.0.2
python: 3.7
browser: Microsoft Edge, Chrome, Internet Explorer
Expect the DataTable widget to show all rows of data, however, the last row is cut off by the horizontal scroll bar and there is no way to see the last row. The only way to see it is to add a row of blanks to the data source, which as you can imagine is not great.
Below is my minimal example code. I am using Tabs, but for simplicity sake I did not include the full code for tab1. I'll just make it a Spacer widget.
I am using bokeh serve to run this because there is interactivity going on in the code.
Changing the height doesn't help anything unless I change the height to show ALL rows. I also tried fit_columns, but that didn't fix the problem either, and there are a lot more columns than what is included in the example.
I would be very grateful to anyone who can provide a solution!
The text was updated successfully, but these errors were encountered: