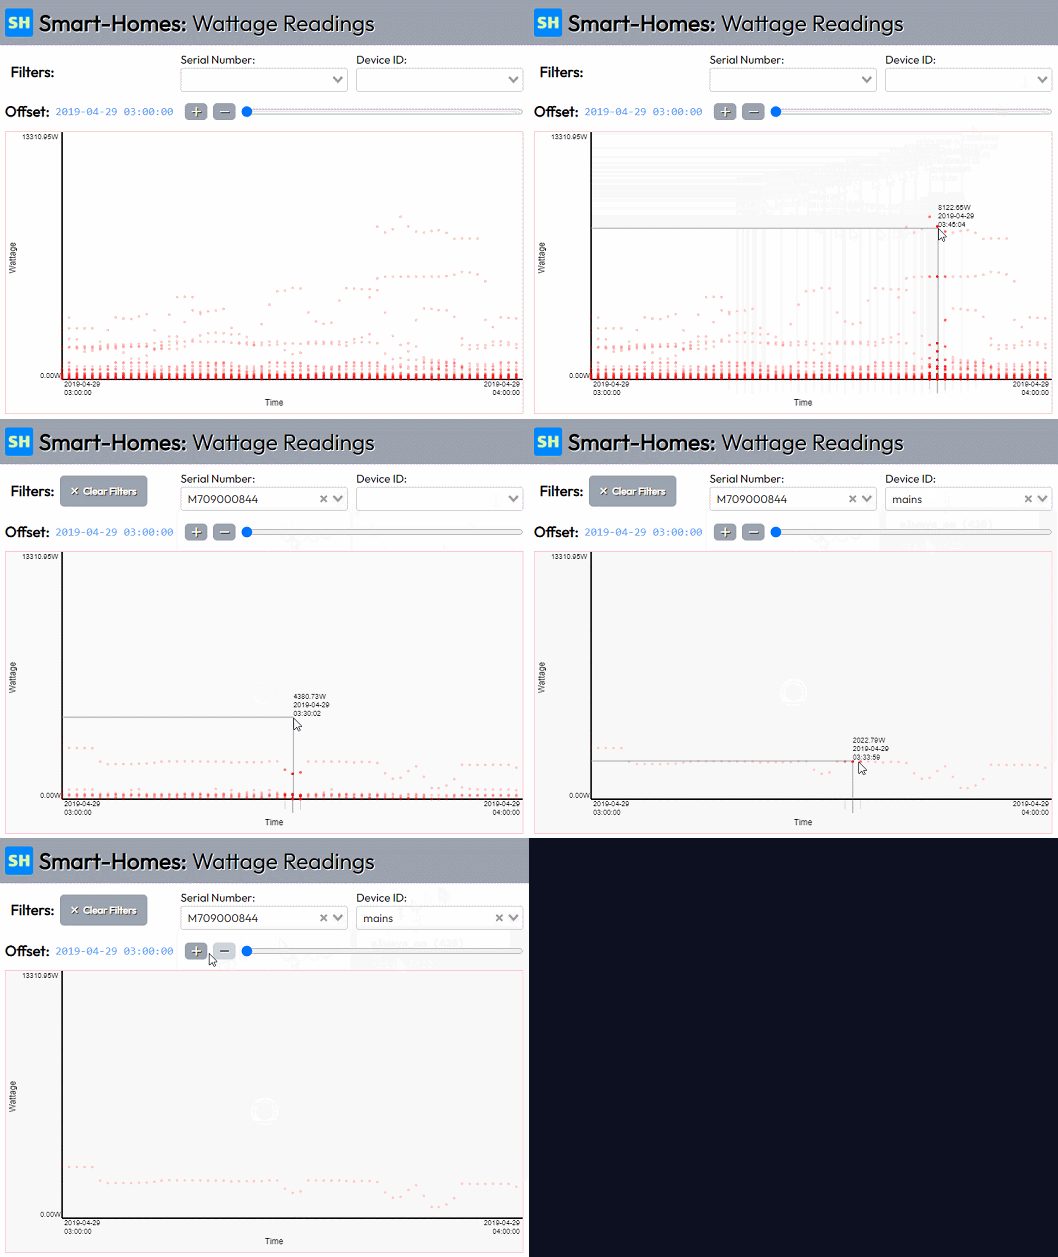
This is a Nuxt-based Coding Challenge project.
Open up a Terminal / CLI in this project directory and run:
npm installor...yarn
To run the development build, you can run:
npm run dev- Browse to
localhost:3000 - Optional: You can enable caching by going to
localhost:3000/usecacheinstead. (More details below)
NOTE: At this time, this is the only mode available given time constraints.
No PROD build unfortunately! :(
TailwindCSS: for styling the Vue app.express: to shoehorn the REST API on top of Nuxt as it runs the live dev-server.
A better approach might be to run this as a dedicated process, but for the sake of simplicity, I chose this route so both the Web App + REST API ran on the same:portnumber (3000).pixi.js: This wasn't the first choice when I started. I actually started off withd3, but once I realized the large amount of data to be displayed, I wasn't confident that SVG drawing was going to be performant enough. Once I made the switch toPIXI, I also experimented to see ifd3could at least supply the measurements to plot the points / lines / etc, but given it was also my first time withd3, I stuck to what I knew and went for a more manual approach you could say!vue-select: Simply a great combo-box plugin! This one exposes a nice<slot>to customize the populating items, which I used to print out the... (123)hits of each items in the fetched data.
-
Realizing the project requirements indicated to use TypeScript! I did my best to convert some of the files quickly to
*.tsand provide as much typing as possible (I definitely overused:anyin multiple places) -
Giving Nuxt a test drive. I've never used this framework before, but since it's widely popular in the Vue community & was recommended for this challenge, I ran with it anyways! Definitely some complications along the way, as far as where to place the Tailwind config, where to inject custom middleware to run on the existing Nuxt
expressapp. -
Deciding where the REST API was going to live. I wasn't actually sure on the correct approach for this, but one goal I set for myself was to run the REST API on the same
:portas the Nuxt app served the development site on. After the fact, maybe not so much a great idea if this was to run completely separately with no knowledge of Nuxt. -
DateTimeTimezone conversion hell...
So, I don't deal with client VS. server timezones a whole lot, at least not on a regular basis enough to catch these oddities. What kept happening was each time I queried "Give me data between X and Y date...", it would tack on +3 hours (given my timezone, AST), so each time I got back the data samples, when came time to render it... because my graph displays only a window of time BUT all the samples are X+3 hours ahead... they never showed up!
Sidenote: I'm not even sure if the "fix" that I came up for the Timezone bugs will work from anywhere this is installed & run from to be quite honest!.
-
Caching, as always! I realize this wasn't part of the requirements, but something felt wrong about hitting that Postgres DB so frequently with so much data being returned.
The approach I took was essentially to turn the SQL statement into an MD5 hash, just something to uniquely identify it among other local filenames. So each time the same SQL statement comes along, first it looks if that file exists, and if loading from cache is desired, loads that JSON. If it doesn't find it, it loads it from the Postgres DB first, massages the data a bit (applies Timezone fix) before saving it to a*.jsonfile in an auto-generated./.private/db-data/folder. -
Squeezing all that data down a bit. As much as I love dealing with JSON in JS / Node projects, there's an overwhelming amount of unnecessary repetition when it comes to the output of DB table rows. So I wrote up some parser / generator methods to break the rows up into single-lines of
PIPE (|)delimited strings, joined with a"keys": "...|...|..."header that indicates what each corresponding entries represent in that compact row-data.
It makes are far more readable format at a glance, and easier to track / compare where things go wrong. This reduces the data by almost a quarter (25%) compared to the raw verbose JSON equivalent. -
Other small challenges... overall I'd say just creating a lot of things from scratch that I could of probably researched more to avoid reinventing the wheel. Drawing that graph from the ground up in particular was not a fun experience lol, but a good learning one.
