This is a collection of interactive visualisations and analyses of data from DOI: 10.1038/srep00196. The article has been made available by Nature Publishing Group (NPG) under a Creative Commons Attribution-Noncommercial 2.5 license, the original data and findings of the research are fully attributed to Nature Publishing Group and the authors; Yong-Yeol Ahn, Sebastian E. Ahnert, James P. Bagrow, Albert-László Barabási. The article and data files used in this repo can be found here: http://www.nature.com/srep/2011/111215/srep00196/full/srep00196.html
R Code is split into several .rmd files that RStudio will use knitr to produce slidy presentations with embedded shiny apps. The apps are as follows:
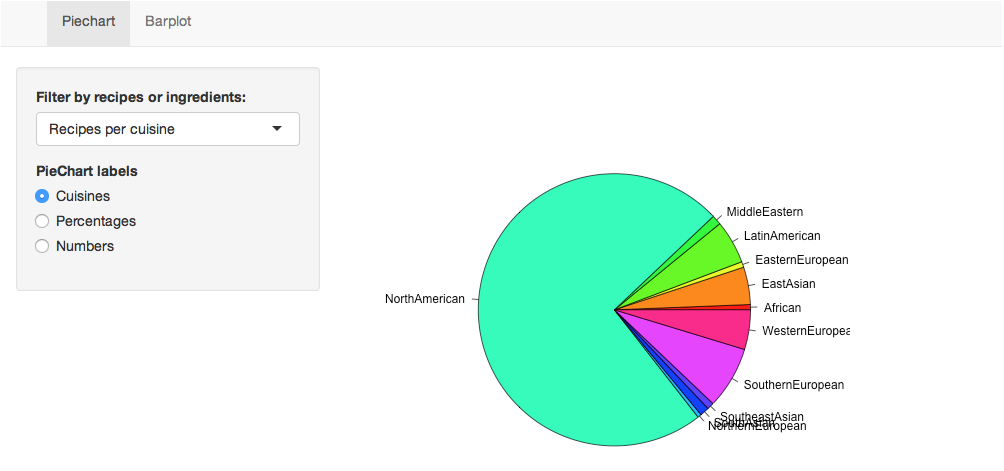
recipePieBarCharts.Rmd
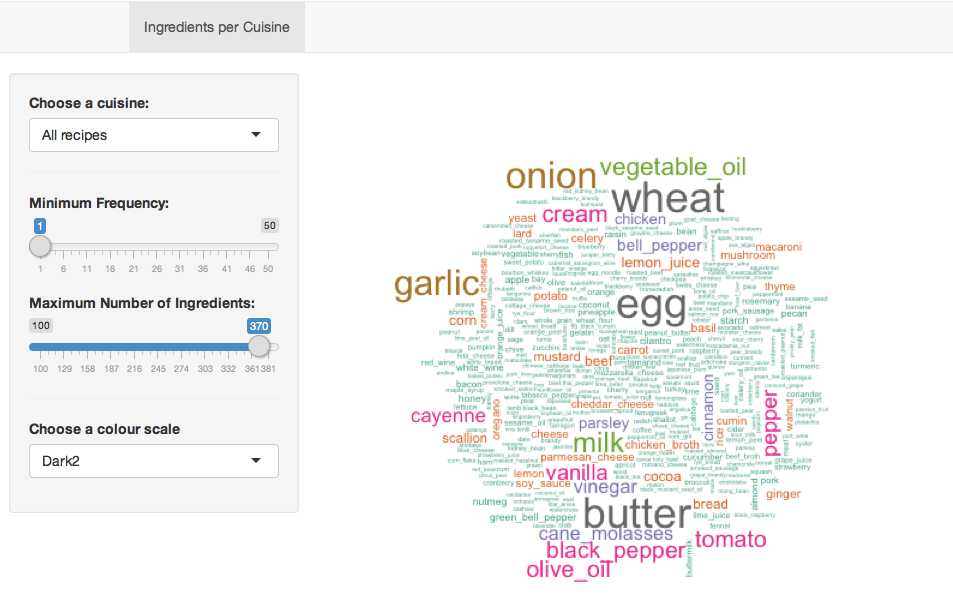
recipeWordclouds.Rmd
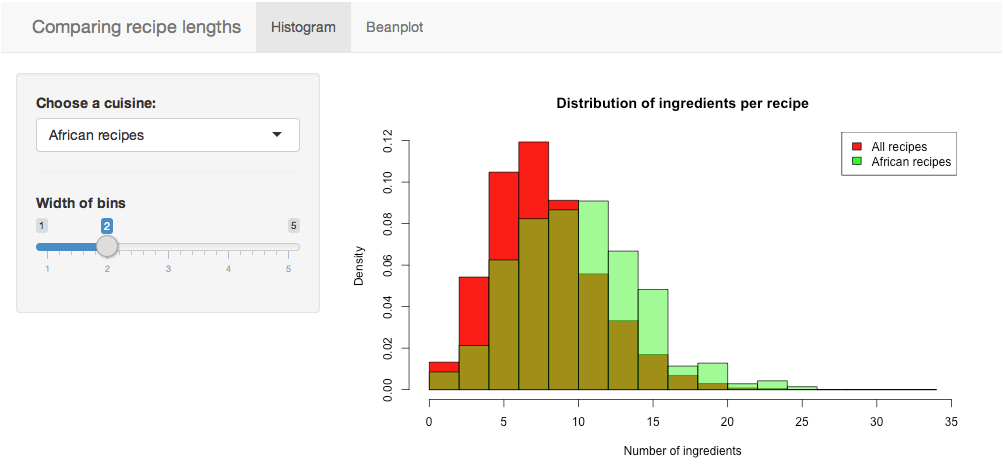
recipeHistBeanplots.Rmd
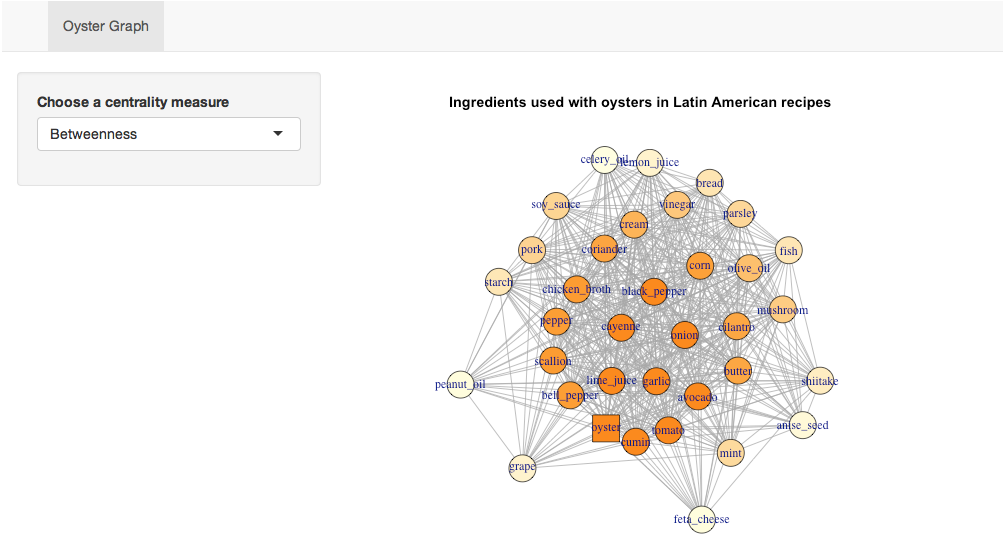
recipeOysterGraph.Rmd
The RecipeVisualisations.wl package contains a number of visualisations of the recipe data. To access these functions clone the repository and evaluate <<RecipeVisualisations note that files within the data folder are loaded by many visualisations for speed, the package contains commented code for generating the .wdx files yourself.
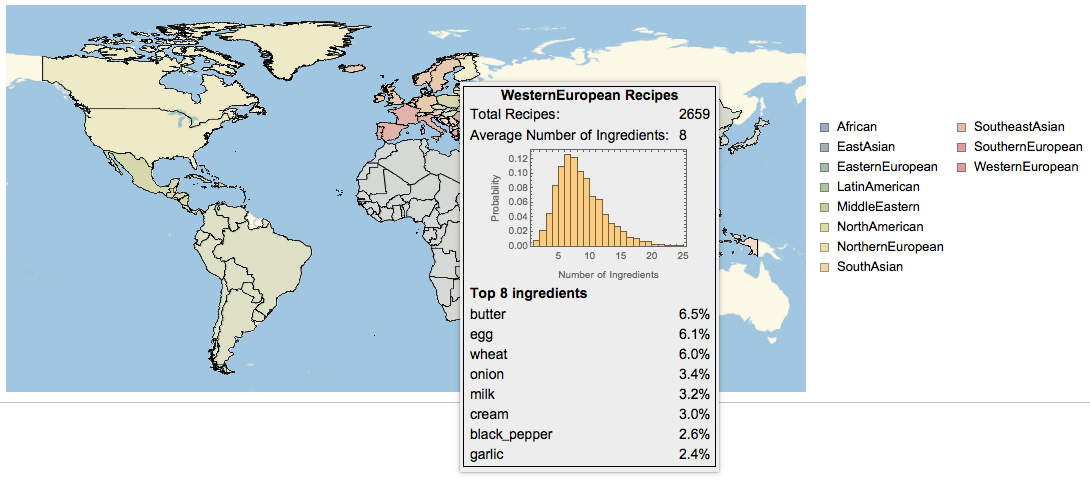
cuisineGeoGraphic[]
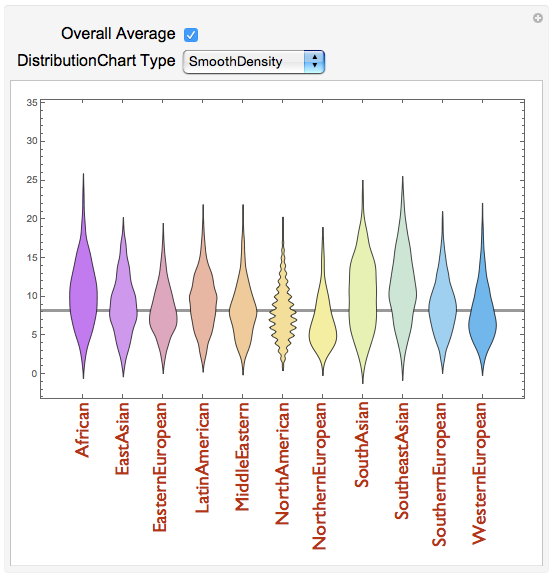
recipleLengthDistViewer[]
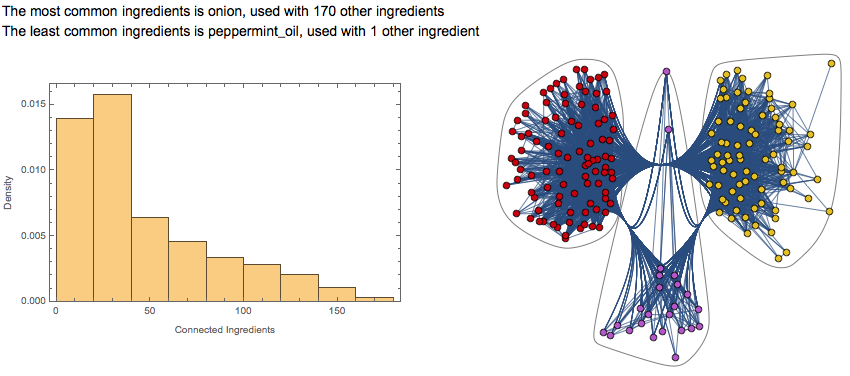
cuisineIngrConnectivity["African"]
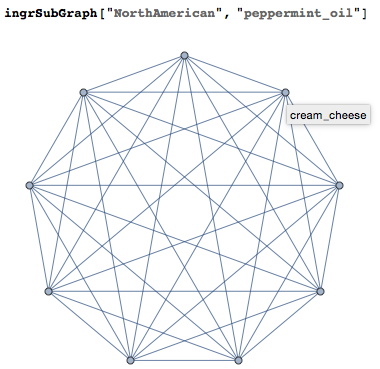
ingrSubGraph["NorthAmerican","peppermint_oil"]
The RecipeClassifier.wl package is dedicated to machine learning analysis of the recipe data set, allowing for the classification of a recipe provided by the user.
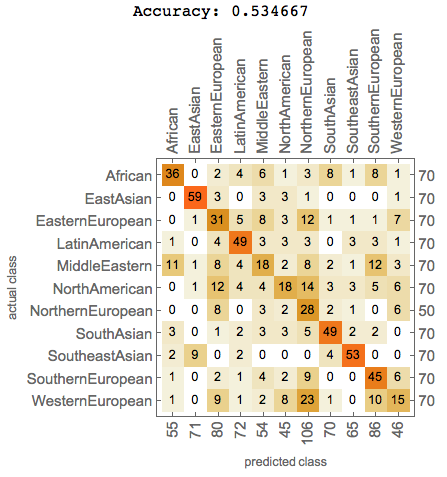
A ClassifierFunction is trained using 282 recipes from each cuisine (200 from Northern Europe) and tested against 70 recipes from each cuisine (50 from North Europe), the resultant ConfusionMatrixPlot is shown below. Cross-validating 50 times provided an average classifier accuracy of 56%
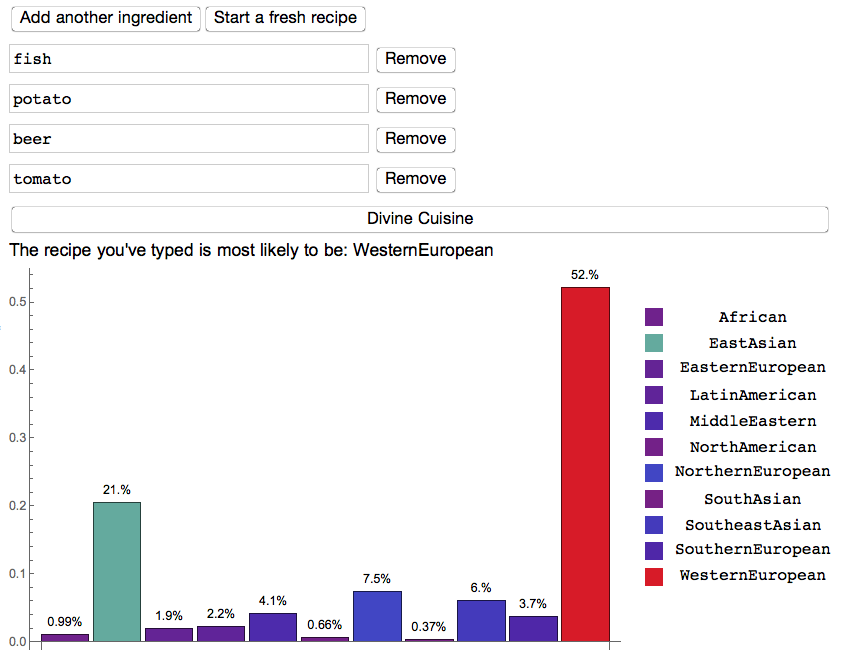
An interactive element for classifying a recipe is provided by recipeInteractiveClassifier in the RecipeClassification.wl package.