adding goodness of fit measures to tbl_regression()
#434
Comments
|
Hello @tormodb ! We have a method for adjusting for multiple testing with the This will only work on univariate regression models. Are you looking perform a correction to a multivariable regression model? In my field I've only seen it applied to univariate analyses, but if it is something people do in other areas I could extend Regarding the other statistics from |
|
Hi, and thanks for the quick response.
I work in psychology and most regression tables will include some fit measures such as r2 and adjusted r2 and the fit of the omnibus model. If you google apa-table you will see many examples. Especially when you add predictors to a model, I.e. adjusting for covarites, it is useful to see the change in r2 and also to test whether the models differ with an anova or likelihood test.
Yes, adjusted p-values are also useful when testing several model, as in the example from Twitter. That trick you referred me to will work, but even better would be to show the p as well as the q as you do for univariable regressions so we can see the effect of the adjustment in the table.
Hilsen Tormod
…On 5 Apr 2020, 16:45 +0200, Daniel Sjoberg ***@***.***>, wrote:
Hello @tormodb !
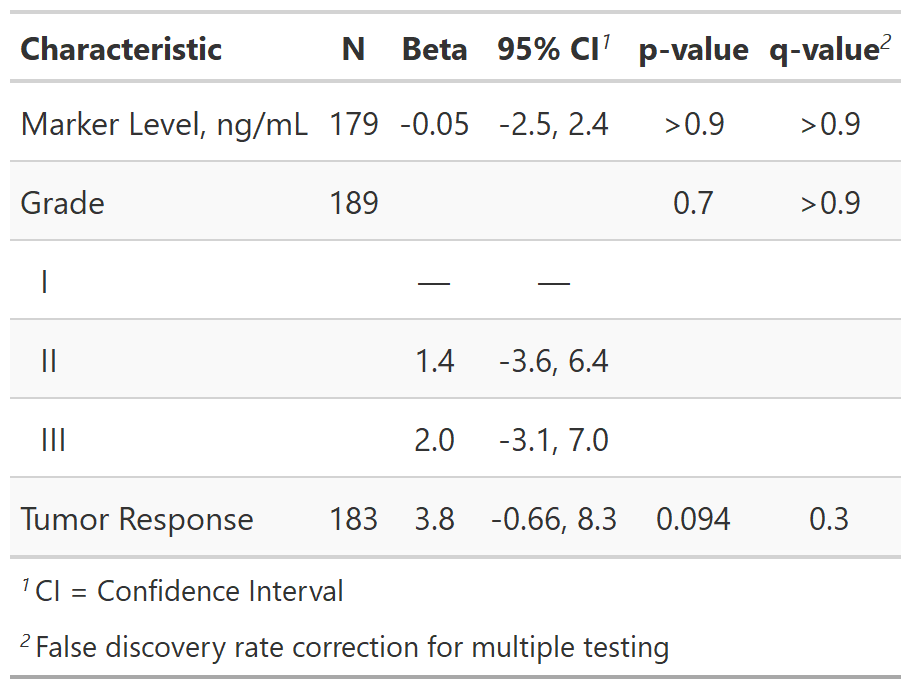
We have a method for adjusting for multiple testing with the add_q() function. Here's an example of the output:
Help file: http://www.danieldsjoberg.com/gtsummary/reference/add_q.tbl_uvregression.html
This will only work on univariate regression models. Are you looking perform a correction to a multivariable regression model? In my field I've only seen it applied to univariate analyses, but if it is something people do in other areas I could extend add_q() quite easily to work with a multivariable model. Someone on twitter posted a work-around for a multivariable model recently (https://twitter.com/healthandstats/status/1241121365647749120).
Regarding the other statistics from tidy::glance()...Our primary goal with {gtsummary} is to create tables that are ready for publication in a journal, and we have not focused on summarizing models for exploratory data analysis. BUT all fields are different and publish results in different formats! Do you routinely publish model summaries with goodness-of-fit measures? Can you point me to some examples, and we can look into adding the functionality
—
You are receiving this because you were mentioned.
Reply to this email directly, view it on GitHub, or unsubscribe.
|
|
I'll keep this issue open, and will think about how best to incorporate the fit statistics in the output (e.g. rows in tables, as footnotes/source notes for the table). In the meantime you can use, the code below to print that statistics you're looking for in the summary table. library(gtsummary)
library(tidyverse)
# building model
mod <- lm(age ~ marker + grade, trial)
# putting fit statistics into a single string
fit_stats <-
broom::glance(mod) %>%
select(`R<sup>2</sup>` = r.squared, AIC) %>%
mutate_all(function(x) style_sigfig(x, digits = 3)) %>%
{paste(names(.), ., sep = " = ", collapse = "; ")}
# summarize model with gtsummary
tbl_regression(mod) %>%
# convert to a gt object
as_gt() %>%
# add source note with fit statistics
gt::tab_source_note(gt::html(fit_stats))
|

|
Fantastic, thanks!
For most of my cases I think it would make sense to put these in rows below the predictors like in other table making packages such as texreg::screenreg, huxtable::huxreg, sjplot::tab_model and modelsummary::modelsummary.
Stay well, and thanks for your help!
Hilsen Tormod
…On 5 Apr 2020, 18:38 +0200, Daniel Sjoberg ***@***.***>, wrote:
I'll keep this issue open, and will think about how best to incorporate the fit statistics in the output (e.g. rows in tables, as footnotes/source notes for the table).
In the meantime you can use, the code below to print that statistics you're looking for in the summary table.
library(gtsummary)
library(tidyverse)

# building model
mod <- lm(age ~ marker + grade, trial)

# putting fit statistics into a single string
fit_stats <-
  broom::glance(mod) %>%
  select(`R<sup>2</sup>` = r.squared, AIC) %>%
  mutate_all(function(x) style_sigfig(x, digits = 3)) %>%
  {paste(names(.), ., sep = " = ", collapse = "; ")}

# summarize model with gtsummary
tbl_regression(mod) %>%
  # convert to a gt object
  as_gt() %>%
  # add source note with fit statistics
  gt::tab_source_note(gt::html(fit_stats))
—
You are receiving this because you were mentioned.
Reply to this email directly, view it on GitHub, or unsubscribe.
|
|
@tormodb FYI, in the dev version of gtsummary, you can now use
|
|
Great, thanks the update and great work on the package.
Hilsen Tormod
…On 6 Apr 2020, 02:37 +0200, Daniel Sjoberg ***@***.***>, wrote:
@tormodb FYI, in the dev version of gtsummary, you can now use add_q() to correct for multiple comparisons on tbl_regression() objects.
> Yes, adjusted p-values are also useful when testing several model, as in the example from Twitter. That trick you referred me to will work, but even better would be to show the p as well as the q as you do for univariable regressions so we can see the effect of the adjustment in the table. Hilsen Tormod
—
You are receiving this because you were mentioned.
Reply to this email directly, view it on GitHub, or unsubscribe.
|
|
Just putting some thoughts here:
table_row <- tibble::tribble(
  ~name, ~type, ~rows, ~value,
  "style_glance", "fmt", "row_type == 'glance'", list(gtsummary::style_sigfig)
)
#> # A tibble: 1 x 4
#>   name         type  rows                 value
#>   <chr>        <chr> <chr>                <list>
#> 1 style_glance fmt   row_type == 'glance' <list [1]>
Created on 2020-04-25 by the reprex package (v0.3.0) |
tbl_regression()
|
Is there a way to add |
At the moment this is not possible, but it will be in the future. Source notes apply to the entire table, and after a merge it's unclear which model the source is associated with. |
|
Great! Looking forward to! |
|
Hi Daniel, thanks for this amazing package! I wonder if there is a simple way of adding C-index on a tbl_uvregression? Thank you! |
|
@silvia-diaz the best place to ask questions about the package use is on stackoverflow.com. Use the gtsummary tag and I'll be notified of your post. Check out this post for the c-index https://stackoverflow.com/questions/71808925 |
Thanks for developing this great package!
Do you have any plans of adding goodness of fit measures for regressions (like those available from broom::glance), and possibilities of adding a-column for adjusted p-values also for the tbl_regression function?
There another package that provides some of these options, the modelsummary package which is also based on gt, but does not use labels and provide as nice default formatting as gtsummary.
The text was updated successfully, but these errors were encountered: