Skip to content
New issue

Have a question about this project? Sign up for a free GitHub account to open an issue and contact its maintainers and the community.

By clicking “Sign up for GitHub”, you agree to our terms of service and privacy statement. We’ll occasionally send you account related emails.

Already on GitHub? Sign in to your account

Performance degradation dotnet core 2.1.300 TieredCompilation #10470

Closed
mrange opened this issue Jun 7, 2018 · 24 comments
Closed

Performance degradation dotnet core 2.1.300 TieredCompilation #10470

mrange opened this issue Jun 7, 2018 · 24 comments

Comments

@mrange
Copy link

mrange commented Jun 7, 2018

I am very excited about Tiered Compilation in dotnet core so I decided to take it for a spin. Unfortunately in my case I found a performance degradation from 370 ms to 540 ms

My dotnet version:

> dotnet --version
2.1.300

My use-case

I am tinkering with a push stream in F#. Push streams are faster than Pull streams (like LINQ). One area where .NET JIT loses against JVM JIT is that .NET JIT is less keen on inlining. With Tiered Compilation I was hoping to see improved inlining improving performance.

Essentially the degradation seems to boil down to that there is an extra jmp in the call chain (as far as I understood this is due to the new jitter introducing an level stub to track stats). I was expected this jmp being eliminated after warmup phase. As the stub don't do any stats tracking it seems to be the final optimized stub to me.

Finally time for some assembly code:

; Top level loop, this identical regardless of COMPlus_TieredCompilation
00007ffc`d5d88ece 3bdf            cmp     ebx,edi
00007ffc`d5d88ed0 7f13            jg      00007ffc`d5d88ee5
00007ffc`d5d88ed2 488bce          mov     rcx,rsi
00007ffc`d5d88ed5 8bd3            mov     edx,ebx
00007ffc`d5d88ed7 488b06          mov     rax,qword ptr [rsi]
00007ffc`d5d88eda 488b4040        mov     rax,qword ptr [rax+40h]
; Virtual call to next step in the push stream
00007ffc`d5d88ede ff5020          call    qword ptr [rax+20h]
00007ffc`d5d88ee1 ffc3            inc     ebx
00007ffc`d5d88ee3 ebe9            jmp     00007ffc`d5d88ece

; The virtual call ends up here which seems left overs from the stats tracking stub.
; This is not present when COMPlus_TieredCompilation=0
00007ffc`d5d88200 e9bb080000      jmp     00007ffc`d5d88ac0

; The next step in the push stream
00007ffc`d5d88ac0 488b4908        mov     rcx,qword ptr [rcx+8] ds:0000023a`000124c0=0000023a000124a0
00007ffc`d5d88ac4 4863d2          movsxd  rdx,edx
00007ffc`d5d88ac7 488b01          mov     rax,qword ptr [rcx]
00007ffc`d5d88aca 488b4040        mov     rax,qword ptr [rax+40h]
00007ffc`d5d88ace 488b4020        mov     rax,qword ptr [rax+20h]
00007ffc`d5d88ad2 48ffe0          jmp     rax

So with Tiered compilation I was hoping for the virtual call to be eliminated (as is the case in JVM JIT) instead I got a performance degradation from 370 ms to 540 ms.

Perhaps I should wait for some more detailed posts on Tiered Compilation as promised here: https://blogs.msdn.microsoft.com/dotnet/2018/05/30/announcing-net-core-2-1/

However, I am quite excited about Tiered Compilation so I wanted to get an early start. Hopefully you tell me I made a mistake.

My F# code:

module TrivialStream =
  // The trivial stream is a very simplistic push stream that doesn't support
  //  early exits (useful for first)
  //  The trivial stream is useful as basic stream to measure performance against

  type Receiver<'T> = 'T            -> unit
  type Stream<'T>   = Receiver<'T>  -> unit

  module Details =
    module Loop =
      // This way to iterate seems to be faster in F#4 than a while loop
      let rec range s e r i = if i <= e then r i; range s e r (i + s)

  open Details

  // Sources

  let inline range b s e : Stream<int> =
    fun r -> Loop.range s e r b

  // Pipes

  let inline filter (f : 'T -> bool) (s : Stream<'T>) : Stream<'T> =
    fun r -> s (fun v -> if f v then r v)

  let inline map (m : 'T -> 'U) (s : Stream<'T>) : Stream<'U> =
    fun r -> s (fun v -> r (m v))

  // Sinks

  let inline sum (s : Stream<'T>) : 'T =
    let mutable ss = LanguagePrimitives.GenericZero
    s (fun v -> ss <- ss + v)
    ss

module PerformanceTests =
  open System
  open System.Diagnostics
  open System.IO

  let now =
    let sw = Stopwatch ()
    sw.Start ()
    fun () -> sw.ElapsedMilliseconds

  let time n a =
    let inline cc i       = GC.CollectionCount i

    let v                 = a ()

    GC.Collect (2, GCCollectionMode.Forced, true)

    let bcc0, bcc1, bcc2  = cc 0, cc 1, cc 2
    let b                 = now ()

    for i in 1..n do
      a () |> ignore

    let e = now ()
    let ecc0, ecc1, ecc2  = cc 0, cc 1, cc 2

    v, (e - b), ecc0 - bcc0, ecc1 - bcc1, ecc2 - bcc2

  let trivialTest n =
    TrivialStream.range       0 1 n
    |> TrivialStream.map      int64
    |> TrivialStream.filter   (fun v -> v &&& 1L = 0L)
    |> TrivialStream.map      ((+) 1L)
    |> TrivialStream.sum

  let imperativeTest n =
    let rec loop s i =
      if i >= 0L then
        if i &&& 1L = 0L then
          loop (s + i + 1L) (i - 1L)
        else
          loop s (i - 1L)
      else
        s
    loop 0L (int64 n)

  let test (path : string) =
    printfn "Running performance tests..."

    let testCases =
      [|
//        "imperative"  , imperativeTest
        "trivialpush" , trivialTest
      |]

    do
      let warmups = 100
      printfn "Warming up..."
      for name, a in testCases do
        time warmups (fun () -> a warmups) |> ignore

    use out                   = new StreamWriter (path)
    let write (msg : string)  = out.WriteLine msg
    let writef fmt            = FSharp.Core.Printf.kprintf write fmt

    write "Name\tTotal\tOuter\tInner\tElapsed\tCC\tCC0\tCC1\tCC2\tResult"

    let total   = 100000000
    let outers =
      [|
        10
        1000
        1000000
      |]
    for outer in outers do
      let inner = total / outer
      for name, a in testCases do
        printfn "Running %s with total=%d, outer=%d, inner=%d ..." name total outer inner
        let v, ms, cc0, cc1, cc2 = time outer (fun () -> a inner)
        let cc = cc0 + cc1 + cc2
        printfn "  ... %d ms, cc=%d, cc0=%d, cc1=%d, cc2=%d, result=%A" ms cc cc0 cc1 cc2 v
        writef "%s\t%d\t%d\t%d\t%d\t%d\t%d\t%d\t%d\t%d" name total outer inner ms cc cc0 cc1 cc2 v

    printfn "Performance tests completed"

[<EntryPoint>]
let main argv =
//  printfn "Attach debugger and hit a key"
//  System.Console.ReadKey () |> ignore
  PerformanceTests.test "perf.tsv"
  0
@jkotas
Copy link
Member

jkotas commented Jun 7, 2018

cc @noahfalk

@noahfalk
Copy link
Member

noahfalk commented Jun 7, 2018

@mrange - Thanks for letting us know!

The extra jmp is a known part of the implementation at the moment at least. I had done some theorizing in the past on how we might eliminate it, but thus far in our testing scenarios it wasn't showing up as a significant perf issue so other aspects of the tiered compilation work took priority and we had left this as-is. Let me take a little time to inspect what you've got and share it with some other perf experts and then we can take it from there.

@kouvel @AndyAyersMS

@AndyAyersMS
Copy link
Member

AndyAyersMS commented Jun 8, 2018

In 2.1 tiered jitting won't give you performance above and beyond what you get with normal jitting. It can improve performance for apps that rely on prejitted code. We are still laying the groundwork to allow tiered jitting to be more aggressive or more adaptive than normal jitting. So keep an eye on things over the next couple of months as we start working towards that.

I wasn't sure which method you were talking about above, so I just picked one to look at after doing a bit of profiling.

While jitting trivialTest@67-1:Invoke(ref):ref:this, the jit inlines Loop:range(int,int,ref,int) and in there is a virtual call that the jit ought to be able to devirtualize, as the call is made via an argument that the jit knows comes from a newobj, and that arg's value stays the same throughout the method. However the language compiler's translation makes it look like this argument is modified and this apparent modification blocks the jit devirtualization efforts.

IL_0000: 
    ldarg.3     
    ldarg.1     
    bgt.s        24 (IL_001c)
    ldarg.2     
    ldarg.3     
    callvirt     0xA00003E  // arg2's class initially known exactly
    pop         
    ldarg.0     
    ldarg.1     
    ldarg.2     
    ldarg.3     
    ldarg.0     
    add         
    starg.s      0x3
    starg.s      0x2        // jit thinks arg2 is modified here
    starg.s      0x1
    starg.s      0x0
    br.s         -28 (IL_0000)
IL_001c:   
    ret  

Devirtualization currently runs very early as we want it upstream of inlining (which also runs very early). So the jit has not yet run any dataflow analysis to determine that a sequence like the above does not actually modify arg2.

If the language compiler could eliminate those same-value assignments then devirtualization would kick in. But it will do so both in normal jitting and in tiered rejitting, so it won't offer the latter any advantage over the former.

// optimized IL that would let the jit devirtualize
IL_0000: 
    ldarg.3     
    ldarg.1     
    bgt.s        IL_001c
    ldarg.2     
    ldarg.3     
    callvirt     0xA00003E  // arg2's class known exactly
    pop         
    ldarg.3     
    ldarg.0     
    add         
    starg.s      0x3
    br.s         IL_0000
IL_001c:   
    ret

Another alternative (which might not be viable) is to mark types like Microsoft.FSharp.Core.FSharpFunc2`` as final (or just mark the Invoke method as final). Then the apparent value modification of arg2 doesn't matter as devirtualization doesn't depend on arg2's value, just its type.

@mrange
Copy link
Author

mrange commented Jun 8, 2018

Hmm thanks for very interesting input @AndyAyersMS. I will try to reimplement this in C# to see if I can get the IL close to what you describe. If that improves performance then I think this could form the case for a PR to F# compiler. I

@AndyAyersMS
Copy link
Member

We're going to keep looking at this too -- while we don't expect tiering to improve perf, we also don't want to see it degrade perf.

@AndyAyersMS
Copy link
Member

Using my homegrown instruction retired explorer tool, I see the following profile breakdown (per-method counts are exclusive instructions retired).

Can't map address 7FF959ACA7B0 -- 11353 counts
Can't map address 7FF959ACA7C8 -- 873 counts
Can't map address 7FF959ACA7E0 -- 14415 counts
Can't map address 7FF959ACA7F8 -- 16507 counts

InstRetired for corerun: 226411 events, 1.483807E+010 instrs
Jitting           : 02.25% 3.34E+08 instructions 575 methods
  JitInterface    : 01.29% 1.92E+08 instructions
Jit-generated code: 61.35% 9.1E+09  instructions
  Jitted code     : 00.95% 1.41E+08 instructions
  ReJitted code   : 60.40% 8.96E+09 instructions
  Ngen   code     : 00.01% 9.18E+05 instructions
  R2R    code     : 00.00% 0        instructions

19.14%   2.84E+09    ?       Unknown
18.28%   2.712E+09   rejit   [18361]Ex+PerformanceTests+trivialTest@67-2.Invoke(int64)
13.99%   2.076E+09   rejit   [18361]Ex+PerformanceTests.loop@72(int64,int64)
11.83%   1.756E+09   rejit   [18361]Ex+PerformanceTests+trivialTest@67-1.Invoke(class Microsoft.FSharp.Core.FSharpFunc`2<int64,class Microsoft.FSharp.Core.Unit>)
10.54%   1.564E+09   rejit   [18361]Ex+PerformanceTests+trivialTest@66.Invoke(int32)
07.23%   1.072E+09   native  ntoskrnl.exe
04.99%   7.398E+08   native  ucrtbase.dll
04.30%   6.382E+08   rejit   [18361]Ex+PerformanceTests+trivialTest@68-4.Invoke(int64)
04.14%   6.147E+08   native  coreclr.dll
01.24%   1.843E+08   native  ntdll.dll
01.19%   1.762E+08   rejit   [18361]Ex+PerformanceTests+trivialTest@69-5.Invoke(int64)
00.96%   1.423E+08   native  clrjit.dll
00.94%   1.397E+08   jit     [18361]Ex+PerformanceTests.time(int32,class Microsoft.FSharp.Core.FSharpFunc`2<class Microsoft.FSharp.Core.Unit,!!0>)
00.81%   1.205E+08   native  CoreRun.exe
00.14%   2.012E+07   rejit   [18361]Ex+PerformanceTests.trivialTest(int32)
00.10%   1.442E+07   rejit   [18361]Ex+PerformanceTests+trivialTest@68-3.Invoke(class Microsoft.FSharp.Core.FSharpFunc`2<int64,class Microsoft.FSharp.Core.Unit>)
00.05%   7.733E+06   native  win32kbase.sys

So it looks like the rejitted code is getting run and the tier0 code gets swapped out, but there are a bunch of IP hits in code blocks that do not map to any managed method or native image, so perhaps those are the prestubs?

@mrange
Copy link
Author

mrange commented Jun 9, 2018

Somewhat offtopic but I am trying to recreate the push streams in C# in order to test your feedback that the F# IL code eliminated the possibility for the jitter to inline virtual calls.

My theory is that I could get the C# compiler IL closer something that could be inlined.

However, I can't get the performance numbers even close to F# when trying to replicate the the push streams in C# (3x slower). Looking at the IL code the jitter has inlined even less. This can be because F# compiler tries to inline small lambdas and using inline the jitter get's more info. However, I thought perhaps you have some tips on how to get the C# code closer to the F# code in terms of performance.

I totally respect if you are too busy with other tasks to look at this:

This is my C# code (which is a replicate of the F# code)


namespace TrivialStreams
{
  using System;
  using System.Runtime.CompilerServices;

  public delegate void Receiver<in T>(T v);
  public delegate void Stream<out T>(Receiver<T> r);

  public static class Stream
  {
    [MethodImpl(MethodImplOptions.AggressiveInlining)]
    public static Stream<int> Range(int b, int s, int e) => 
      r =>
        {
          for(var i = 0; i <= e; i += s)
          {
            r(i);
          }
        };

    [MethodImpl(MethodImplOptions.AggressiveInlining)]
    public static Stream<T> Filter<T>(this Stream<T> t, Func<T, bool> f) =>
      r => t(v => 
        {
          if (f(v)) r(v);
        });

    [MethodImpl(MethodImplOptions.AggressiveInlining)]
    public static Stream<U> Map<T, U>(this Stream<T> t, Func<T, U> m) =>
      r => t(v => r(m(v)));

    [MethodImpl(MethodImplOptions.AggressiveInlining)]
    public static long Sum(this Stream<long> t)
    {
      var sum = 0L;

      t(v => sum += v);

      return sum;
    }
  }

}

I tried using abstract classes for the receivers, it gave a performance boost but a minor one.

Hmm, since I just want to test jitter here perhaps I should just decompile the F# code into C#, clean it up and run C# on it.

@AndyAyersMS
Copy link
Member

It's probably easier for me to prototype this in the jit.

The relevant check is here, where the jit is trying to evaluate what it knows about the actual type of an argument when inlining:
https://github.com/dotnet/coreclr/blob/911d332c523848023e3c6564788b72b7f419fca1/src/jit/importer.cpp#L18728-L18744
We just want to act like argCanBeModified is always false (at least for method in your test case).

@AndyAyersMS
Copy link
Member

Hmm, turns out to be not all that interesting on its own -- devirtualization kicks in but inlining is blocked because the jit won't inline methods with tail prefixes...

 Inlines into 06000011 trivialTest@67-1:Invoke(ref):ref:this
   [1 IL=0007 TR=000010 0600000E] [below ALWAYS_INLINE size] trivialTest@67-2:.ctor(ref):this
     [2 IL=0001 TR=000026 06000150] [below ALWAYS_INLINE size] Microsoft.FSharp.Core.FSharpFunc`2[Int64,__Canon][System.Int64,System.__Canon]:.ctor():this
      [3 IL=0001 TR=000034 06000191] [below ALWAYS_INLINE size] System.Object:.ctor():this
   [4 IL=0012 TR=000018 06000005] [below ALWAYS_INLINE size] PerformanceTests:arg@1(int,ref)
     [5 IL=0003 TR=000050 0600000C] [below ALWAYS_INLINE size] trivialTest@66:.ctor(ref):this
       [6 IL=0001 TR=000063 06000150] [below ALWAYS_INLINE size] Microsoft.FSharp.Core.FSharpFunc`2[Int32,__Canon][System.Int32,System.__Canon]:.ctor():this
        [7 IL=0001 TR=000071 0600018A] [below ALWAYS_INLINE size] System.Object:.ctor():this
     [8 IL=0009 TR=000055 0600005A] [profitable inline] Loop:range(int,int,ref,int)
-      [0 IL=0006 TR=000089 0600014F] [FAILED: target not direct] Microsoft.FSharp.Core.FSharpFunc`2[Int32,__Canon][System.Int32,System.__Canon]:Invoke(int):ref:this
+      [0 IL=0006 TR=000089 0600000D] [FAILED: explicit tail prefix in callee] trivialTest@66:Invoke(int):ref:this

...and trying to alter that aspect of jit behavior is not so simple. It is probably worth re-examining the jit's logic for inlining in the presence of explicit tail calls (#18406).

Local measurements for just the trivialpush cases shows mostly a small win (not sure what's up with the very last number):

No Tiering

  ... 397 ms, cc=0, cc0=0, cc1=0, cc2=0, result=25000010000001L
  ... 413 ms, cc=0, cc0=0, cc1=0, cc2=0, result=2500100001L
  ... 548 ms, cc=26, cc0=26, cc1=0, cc2=0, result=2601L

Ignore arg store when propagating type

  ... 388 ms, cc=0, cc0=0, cc1=0, cc2=0, result=25000010000001L
  ... 387 ms, cc=0, cc0=0, cc1=0, cc2=0, result=2500100001L
  ... 535 ms, cc=26, cc0=26, cc1=0, cc2=0, result=2601L

Tiering

  ... 472 ms, cc=0, cc0=0, cc1=0, cc2=0, result=25000010000001L
  ... 477 ms, cc=0, cc0=0, cc1=0, cc2=0, result=2500100001L
  ... 612 ms, cc=26, cc0=26, cc1=0, cc2=0, result=2601L

Tiering + Ignore arg store when propagating type

  ... 459 ms, cc=0, cc0=0, cc1=0, cc2=0, result=25000010000001L
  ... 463 ms, cc=0, cc0=0, cc1=0, cc2=0, result=2500100001L
  ... 649 ms, cc=26, cc0=26, cc1=0, cc2=0, result=2601L

@AndyAyersMS
Copy link
Member

A bit more hacking and I can get trivialTest@66:Invoke(int):ref:this to inline... inlining below that point is now blocked because this method makes a virtual call via its field. Even though we see the ctor above we can't propagate info down.

Perf improves slightly:

Ignore arg store + allow explicit tail call inline

  ... 362 ms, cc=0, cc0=0, cc1=0, cc2=0, result=25000010000001L
  ... 362 ms, cc=0, cc0=0, cc1=0, cc2=0, result=2500100001L
  ... 513 ms, cc=26, cc0=26, cc1=0, cc2=0, result=2601L

Odd tiering perf might be from using a CHK jit -- it will be slower to rejit and so the faster tier1 code won't get patched in quite as quickly. Will need to redo with a release build .

@mrange
Copy link
Author

mrange commented Jun 10, 2018

Interesting. I remember seeing some code in improved seq module that aimed to turn off .tail attribute. Never understood why they bother but now I see it might be to allow inlining.

@mrange
Copy link
Author

mrange commented Jun 10, 2018

Tried applying .tail suppressing but that didn't get it to inline it for me. Instead of the jmp rax I have call qword ptr [rax+20h] which makes sense but is slower because stack frames must be unwind when call returns.

From your comments I thought I would perhaps see calls inlined but perhaps I did something wrong.

FYI; trivial stream with .tail suppression.

    module TrivialStream =
      // A very simple push stream
      type Receiver<'T> = 'T            -> unit
      type Stream<'T>   = Receiver<'T>  -> unit

      module Details =
        let inline suppressTailCall u = match u with () -> ()
        //let inline suppressTailCall u = u
        module Loop =
          let rec range s e r i = if i <= e then r i; range s e r (i + s)

      open Details

      let inline range b s e : Stream<int> =
        fun r -> Loop.range s e r b

      let inline filter (f : 'T -> bool) (s : Stream<'T>) : Stream<'T> =
        fun r -> s (fun v -> if f v then suppressTailCall (r v))

      let inline map (m : 'T -> 'U) (s : Stream<'T>) : Stream<'U> =
        fun r -> s (fun v -> suppressTailCall (r (m v)))

      let inline sum (s : Stream<'T>) : 'T =
        let mutable ss = LanguagePrimitives.GenericZero
        s (fun v -> ss <- ss + v)
        ss

@mrange
Copy link
Author

mrange commented Jun 10, 2018

Clarification; .NET 4.7.1 and dotnet core shows the same behavior when surpressing tail calls.

With tail calls:

Running performance tests...
Warming up...
  ... 380 ms, cc0=0, cc1=0, cc2=0, result=25000010000001L
  ... 384 ms, cc0=0, cc1=0, cc2=0, result=2500100001L
  ... 426 ms, cc0=53, cc1=0, cc2=0, result=2601L

Tail calls surpressed

  ... 492 ms, cc0=0, cc1=0, cc2=0, result=25000010000001L
  ... 492 ms, cc0=0, cc1=0, cc2=0, result=2500100001L
  ... 541 ms, cc0=53, cc1=0, cc2=0, result=2601L

@AndyAyersMS
Copy link
Member

The tail call stuff was done on top of the hack to get devirtualization working. I haven't looked at it in isolation (and it's currently even more hacky than the devirt change, so not even worth sharing out yet).

@mrange
Copy link
Author

mrange commented Jun 11, 2018

If I have understood you correctly tiered compilation doesn't improve sustained performance compared to the default setting then the purpose for tiered compilation is improve startup performance?

For a "large" program (10+ MiB) what kind of improvements have you seen?

@AndyAyersMS
Copy link
Member

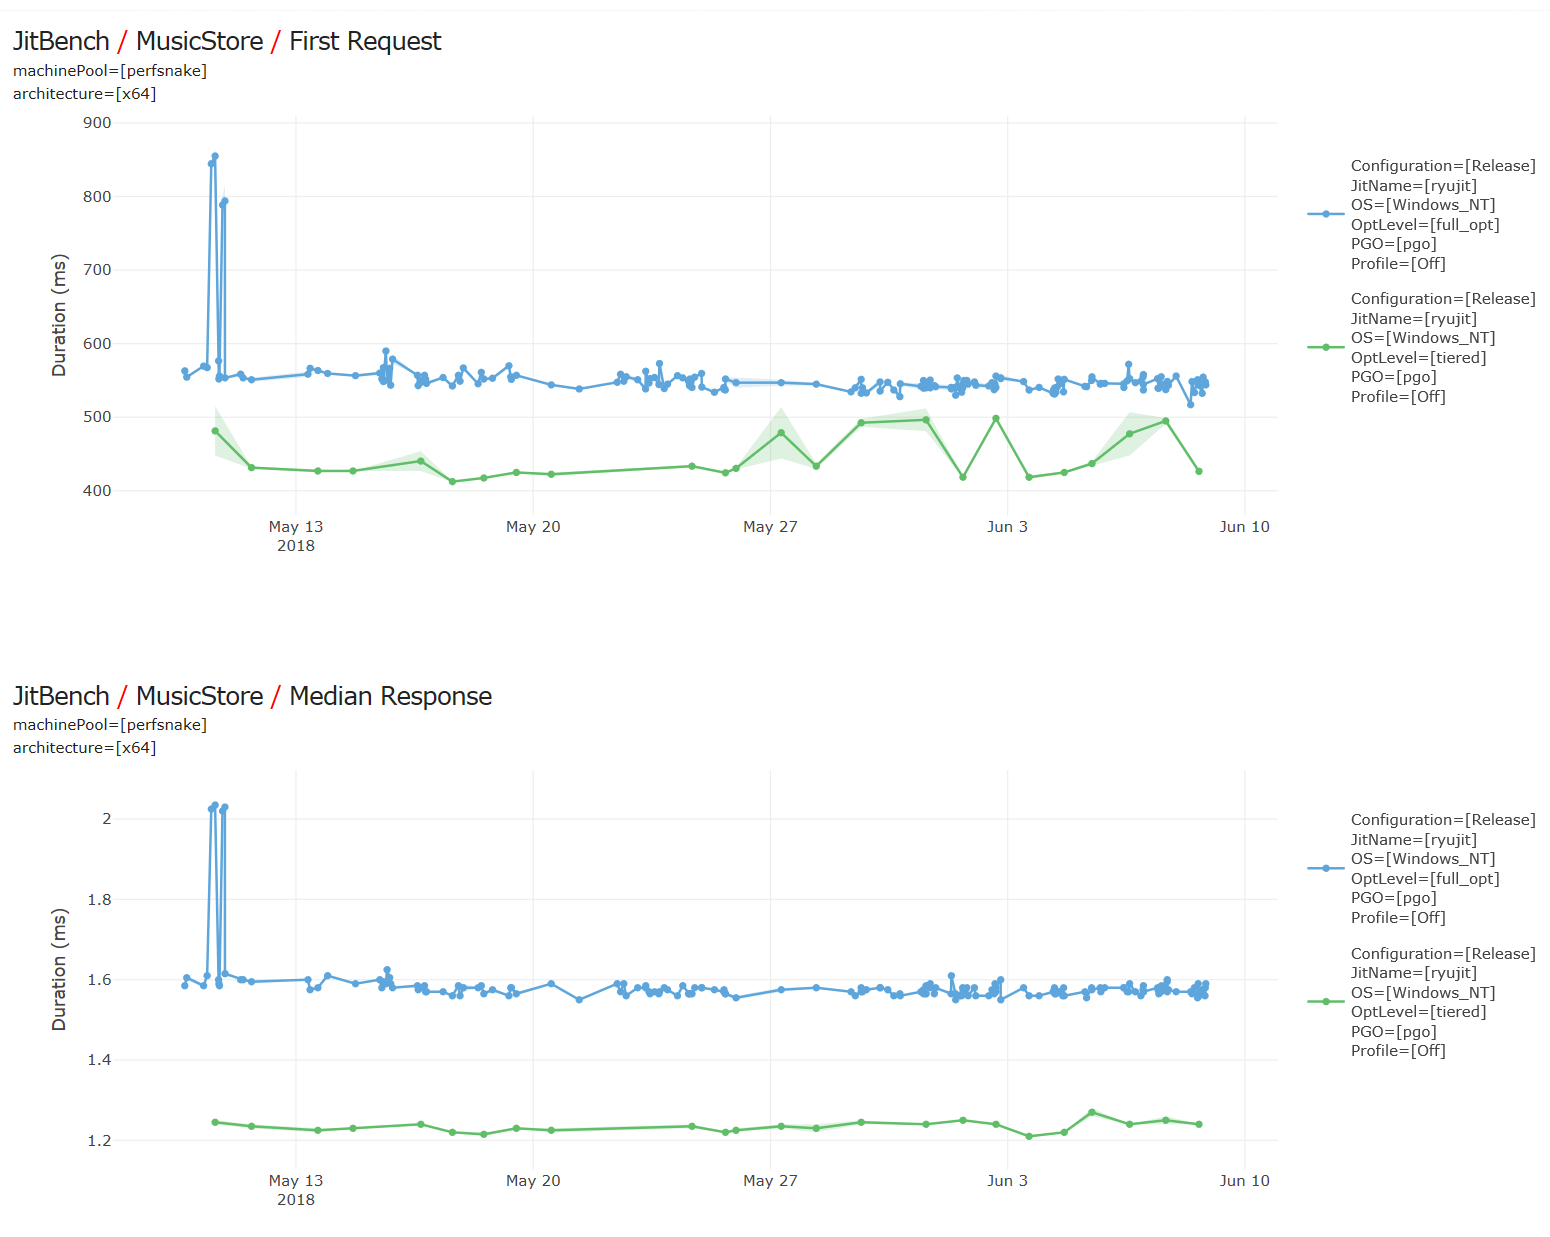
Apps that rely heavily on prejitted code will see faster startup and better steady state performance. For example, on the ASP.Net sample music store app, about 20% faster first response, and 20% better overall throughput. In charts below, lower is better (y axis is time), and green line/dots are from runs with tiered jitting enabled.
image
Startup wins come from faster initial jitting (as not all methods can be prejitted). Steady state wins because jitted code has better perf than prejitted code (fewer indirections, more inlining, etc).

@noahfalk
Copy link
Member

To tidy up one of the loose ends above, the unresolved addresses in the analysis of instruction retired events do look like Precode jmp instructions. In case anyone else needs to repeat the analysis what I did was:

  1. add waiting for debugger at the end of the test app:
[<EntryPoint>]
let main argv =
  PerformanceTests.test "perf.tsv"
  printfn "Attach debugger and hit a key"
  System.Console.ReadKey () |> ignore
  0
  1. Take a trace and stop when the app waits for the debugger
  2. After analysis is complete, attach windbg and dump the contents of the mystery addresses:
0:000> u 7ffcf22a6978
Program+PerformanceTests+trivialTest@69-5.Invoke(Int64):
00007ffc`f22a6978 e9b3db0000      jmp     repro18361!Program+PerformanceTests+trivialTest@69-5.Invoke(Int64)+0xc1d0 (00007ffc`f22b4530)
00007ffc`f22a697d 5f              pop     rdi
0:000> u 7ffcf22a6990
Program+PerformanceTests+trivialTest@68-4.Invoke(Int64):
00007ffc`f22a6990 e96bdb0000      jmp     repro18361!Program+PerformanceTests+trivialTest@68-4.Invoke(Int64)+0xc200 (00007ffc`f22b4500)
00007ffc`f22a6995 5f              pop     rdi
0:000> u 7ffcf22a7810
Program+PerformanceTests+trivialTest@67-2.Invoke(Int64):
00007ffc`f22a7810 e9bbcc0000      jmp     repro18361!Program+PerformanceTests+trivialTest@67-2.Invoke(Int64)+0xc240 (00007ffc`f22b44d0)
00007ffc`f22a7815 5f              pop     rdi
0:000> u 7ffcf22a7828
Program+PerformanceTests+trivialTest@66.Invoke(Int32):
00007ffc`f22a7828 e973cc0000      jmp     repro18361!Program+PerformanceTests+trivialTest@66.Invoke(Int32)+0xc270 (00007ffc`f22b44a0)
00007ffc`f22a782d 5f              pop     rdi

@AndyAyersMS
Copy link
Member

Could we get the runtime to emit some kind of ETL record for the precode and similar? I noticed we have something like this under FEATURE_PERFMAP.

@noahfalk
Copy link
Member

Yeah, I don't see why not other than someone needs to set aside some time to work through it. I just created dotnet/coreclr#18428 there to track it.

@AndyAyersMS
Copy link
Member

So does this summary seem accurate?

  • This benchmark has a very high call to work ratio (in part because jit devirtualization and inlining aren't as effective as one might hope). This is true in both normally jitted and tier1 jitted code.
  • Tiering is updating the key method bodies, but methods are called through precode even in tier1 code.
  • The extra cost of calling through precode leads to slower performance of the tier1 code overall (data above suggests ~20% of the instructions executed come from precode, and performance with tiering is about 20% slower than with straight jitting).

If there is always going to be some additional call overhead in Tier1 then we should consider making the jit inline more aggressively. But in this case it would not help to simply turn up the dial; we need new capabilities in the jit and perhaps some IL level modifications from FSC.

I opened dotnet/coreclr#18406 to look at making inlining more effective in the presence of explicit tail calls.

Elsewhere I think we're looking at options to avoid or reduce the cost of precode, since we are going to encounter more cases like this that put a premium on call overhead.

@noahfalk
Copy link
Member

Yeah, that feels like a good summary to me.

If there is always going to be some additional call overhead in Tier1 then we should consider making the jit inline more aggressively.

I don't think of it as tier1 has to have extra overhead, more that getting rid of that overhead entirely is non-trivial and likely won't give results that are as good as jit inlining. If the jit inlining is sufficiently hard and the scenarios are common/important for real world apps then I'd say we should invest. I hope jit inlining can be our 1st choice of solution though and reducing tier 1 call overhead is the fallback position.

@AndyAyersMS
Copy link
Member

We will certainly look at making the inliner more aggressive overall in Tier1, but I think we also need to make the inliner more capable.

Relatively soon I hope to start having the inliner take advantage of profile feedback, whether synthetic, via IBC or similar off-line channels, or from some in-process measurement. And after that we will likely need to work on guarded speculation for indirect calls, possibly also informed by in-process feedback.

@mrange
Copy link
Author

mrange commented Jun 13, 2018

Just to give some context from my point of view:

WRT to high call to work that was the intention of my performance test to begin with. I compare the impact of datapipelines. For non-trivial "work" the overhead of the datapipelines disappears.

I was hoping with tiered compilation to see more code being devirtualized and inlined and thus reduce the overhead of the datapipeline abstractions.

Just to give even more context:

I have tinkered with datapipelines in C++ (https://github.com/mrange/cpplinq) and Java as well.

Because of how C++ lambdas works more information is "easily" available to the compiler and is capable of eliminating the overhead almost entirely (auto vectorizer never seems to work with datapipelines and end of loop conditions placed sub-optimally).

In Java that has supported (AFAIK) tiered compilation for a long time. Java Streams seems to perform much better than what I am able to do in .NET. OFC this requires me to use the specialized *Streams in order to remove the overhead of boxing. I don't have any assembly code available but from what I remember Java jitter did a better job on devirtualization and inlining. Because of the tiered compilation in Java the first tiers were doing worse than .NET but the latter ones were doing better.

Obviously since I am having a soft spot for .NET I am hoping that .NET will catchup and out-perform the competitors.

WRT to F# inline; F# inline is actually intended to allow a richer generics than supported in .NET (also a trick used in kotlin) but it also seems to help with performance for datapipelines as I am currently unable to get C# datapipelines to do as well as my F# datapipelines. Maybe because I am not smart enough.

@kouvel
Copy link
Member

kouvel commented Dec 18, 2018

Would be addressed by fix for https://github.com/dotnet/coreclr/issues/19752

@kouvel kouvel closed this as completed Dec 18, 2018
@msftgits msftgits transferred this issue from dotnet/coreclr Jan 31, 2020
@dotnet dotnet locked as resolved and limited conversation to collaborators Dec 16, 2020
Sign up for free to subscribe to this conversation on GitHub. Already have an account? Sign in.
Projects
None yet
Development

No branches or pull requests

5 participants