Reporting timeout errors on 6.4.0 - Max attempts reached (3) #21443
Comments
|
Don't know if it helps, I tried removing Vega visualization from the dashboard and was able to generate a report successfully out of the dashboard. |
|
I am also seeing this problem, so it is not isolated to one environment. |
|
not sure if its just vega which is causing this but generating a vega visualization has meet a hit and miss. I added a single vega visualization to a newly created dashboard and generated just one fresh report of the same. It said it did it successfully but the report was not properly rendered. see attached. |
|
@rasroh Looking at the report this seems to look like the Vega spec you use is invalid. Does the same happen for you in case you use a valid specification (e.g. the default one from the editor)? |
|
This is what I see when I run a report on one of the Vega visualizations:
So, I suspect you're right about this being a Vega issue. |

|
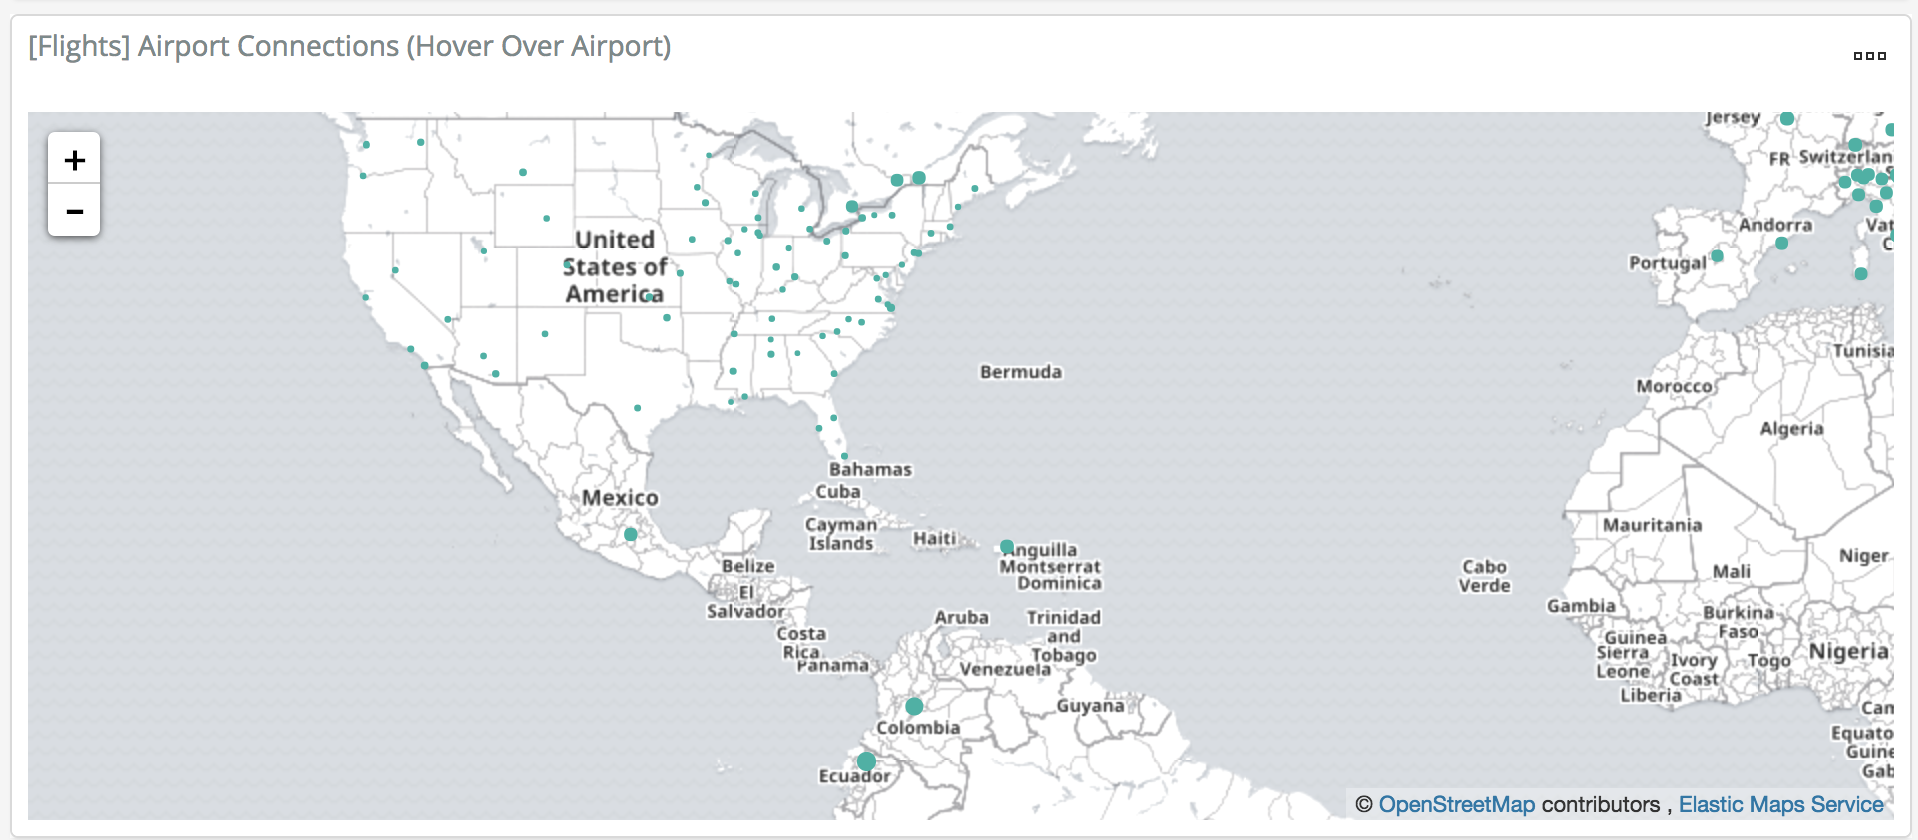
@timroes : I tried generating a report with just an inbuilt vega visualization ( [Flights] Airport Connections (Hover Over Airport)) .It does say the report is generated successfully, but when you open the report it says - undefined is not a function . Attaching the report . |
|
It's not a Vega issue, as I can get dashboards to render w/ that same Vega control on them. There's something else going on. |
|
This appears to be caused by the markdown visualization. A markdown file with a link in it times out. One without a link completes in a matter of seconds. I think it must be trying and failing to resolve the links or something like that. |
|
hmm but that vega doesn't render in reporting is def an issue on it self as it seems. @rasroh can you actually try the same vega visualization (if the flight one does not work, just create a new one in the editor, there is a default spec that should draw a chart), in 6.3 and see if that's actually a regression, i.e. the very same vega vis does not report correctly in 6.4,, but in 6.3? |
|
OK... It took a while. I'd like to know if there's a good way to see log messages coming out of visualizations during the reporting phase. The issue seems to be with |
|
This is an ongoing issue, apparently. The Vega visualization is hanging in Rashmi's Cent OS VM. She's running Kibana with these settings: I think I'll hand it over to you all, as Vega is beyond me! The visualization she's running is the Vega visualization from our sample data:
I'm not sure if it's the Vega plugin itself or something hanging with Open Street Maps. I can dig into it later this week if neither of you can get to it first. I've been unable to reproduce the problem on Mac, so it may be a Linux or even Cent OS Chromium issue, or it could be something corrupted in that specific VM. |
These are my settings from |
|
@nyurik cc |
|
I have a hunch that the error we are hitting is for vega viz which is marked experimental . So am removing the blocker label . |
|
@rasroh since it seems, that the issue is kind of having a lot of discussion around several vis types, could you please open a separate issue for Vega failing in reporting, so we can track that separately? |
|
I think there are two unrelated issues here: the report generation timeout issue, and the Vega graphs not working with the default The Vega graph generation does consistently fail (creates an empty graph with the Vega error message) unless the browser type is set to |
|
Upon some further investigation, it seems this bug only appears when map mode is used. Minimum repo: {
$schema: https://vega.github.io/schema/vega/v3.0.json
config: {
kibana: {type: "map"}
}
} |
|
Yeah. @nyurik I suspect it's something to do with flaky network connectivity when loading map tiles (or something along these lines) which is why it's so infrequent and unpredictable. |
|
on a beefy 4gig Kibana ram on a cloud instance - I tried generating reports - and every time it passes. |
|
Both issues have been fixed - slowness - by increasing Kibana mem space, and vega maps - just merged a patch to master, 7.0, and 6.4. |
|
@nyurik @rasroh - was this issue closed because we resolved the underlying problem or because we were able to get around it by changing the Cloud instances? We shouldn't expect users to have to change settings in order to have a stable Kibana. |
|
@tylersmalley kinda both. The issue with Vega maps was a legitimate one -- Babel tool had a bug in the older version that we were using, so I had to fix the code to work around it. Now Vega maps show up properly (code was backported to 6.4). The other issue is trickier -- can Kibana render complex dashboards to PDF if it has very small memory allocation (1GB), and has a lot of graphs. I would say that it is far better to crash early and report that error (thus other users won't be affected), than to take forever, taking down all other Kibana users of the same server. The only possible improvement could be to improve an error message, e.g. to say that "queries timedout. You may consider increasing Kibana server memory". |
|
Thanks for the update @nyurik. Do you feel that this would warrant increasing the default size of Kibana instances on Cloud? |
|
@nyurik @tylersmalley : would it make sense to keep this bug open until 6.4. goes out |
|
@tylersmalley Yes. 1GB of memory is too small to run Kibana server and reporting |
Kibana version: BC1 of 6.4.0
Elasticsearch version: BC1 of 6.4.0
Server OS version: Centos
Browser version: Chromium
Original install method (e.g. download page, yum, from source, etc.): BC1
Describe the bug: Reporting failure - Errors out with the following message
Max attempts reached (3)Steps to reproduce:
Max attempts reached (3)The report generation took a long while - I checked the network tab of the console and this was shown
I tailed the logs and it was stuck at this line
and finally it timed out :
attaching full logs :
reporting logs.pdf
The text was updated successfully, but these errors were encountered: