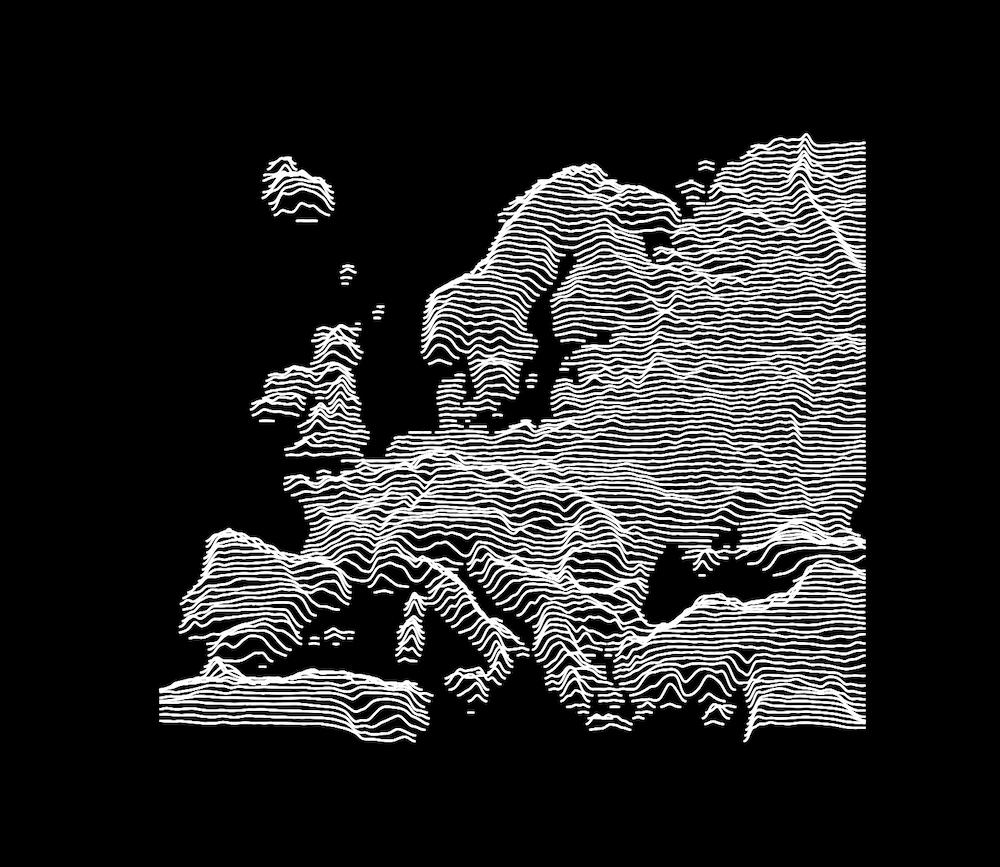
The cover of Joy Division’s 1979 album Unknown Pleasures has entered pop culture and became an iconic image even for people that have never heard the album. The type of chart is officially called a ridgeline plot but Unknown Pleasures is so influencial that it is also sometimes referred to as a Joyplot.
A few days ago I stumbled upon a post on Reddit where a user created a ridgeline plot/Joyplot of the elevation levels of some US state. It looked great but they did not provide any code so I decided to implement it myself. I’ll describe how I did it so you can follow along and create your own maps.
Read full blog post here: https://flxn.de/posts/joy-divison-style-topographic-maps/
$ python3 topojoy.py --help
usage: topojoy.py [-h] [--continuous] [--lines LINES] [--scale SCALE]
                  [--line-width LINE_WIDTH] [--roughness ROUGHNESS]
                  [--line-color LINE_COLOR]
                  [--background-color BACKGROUND_COLOR]
                  image

Converts an image of a topographic map into a ridgeline plot

positional arguments:
  image

optional arguments:
  -h, --help            show this help message and exit
  --continuous, -c      instead of only drawing the raised portions, draw each
                        plot line continously for the whole width
  --lines LINES, -l LINES
                        number of plot lines
  --scale SCALE, -s SCALE
                        max elevation difference, higher = larger difference
                        between low and high spots on the map
  --line-width LINE_WIDTH, -w LINE_WIDTH
                        the width of the plot lines
  --roughness ROUGHNESS, -r ROUGHNESS
                        the smoothing factor, higher = smoother terrain, lower
                        = rougher terrain
  --line-color LINE_COLOR
                        the color of the lines (https://matplotlib.org/3.1.0/g
                        allery/color/named_colors.html)
  --background-color BACKGROUND_COLOR
                        the color of the background (https://matplotlib.org/3.
                        1.0/gallery/color/named_colors.html)
Then you can simply run it like so with default settings:
python3 topojoy.py image.png
Not every topographical map you can find works well with this approach.
For best results it should not contain any text or markings and should of course have a nice blue to green to red color scheme. For the map of europe I used this one from the European Environment Agency which worked very well: https://www.eea.europa.eu/data-and-maps/data/digital-elevation-model-of-europe

