![]()


![]()
A
docker-composeandkubernetesstack to run a set of ISP controls and collect metrics on a Raspberry Pi oramd64architecture.
 LinkedIn
 GitHub
- Platforms
- Download
- Kubernetes
- Configuration
- Installation
- Login
- Removing
- Concepts
- ToDo
- Stargazers
- Contributing
- License
Fibertel, the most popular Argentinian Internet provider always has connectivity issues. It inspired me to use a Raspberry Pi and build some type of monitoring to aggregate metrics. I have been using Grafana at work for several years, so why not use the same logic?.
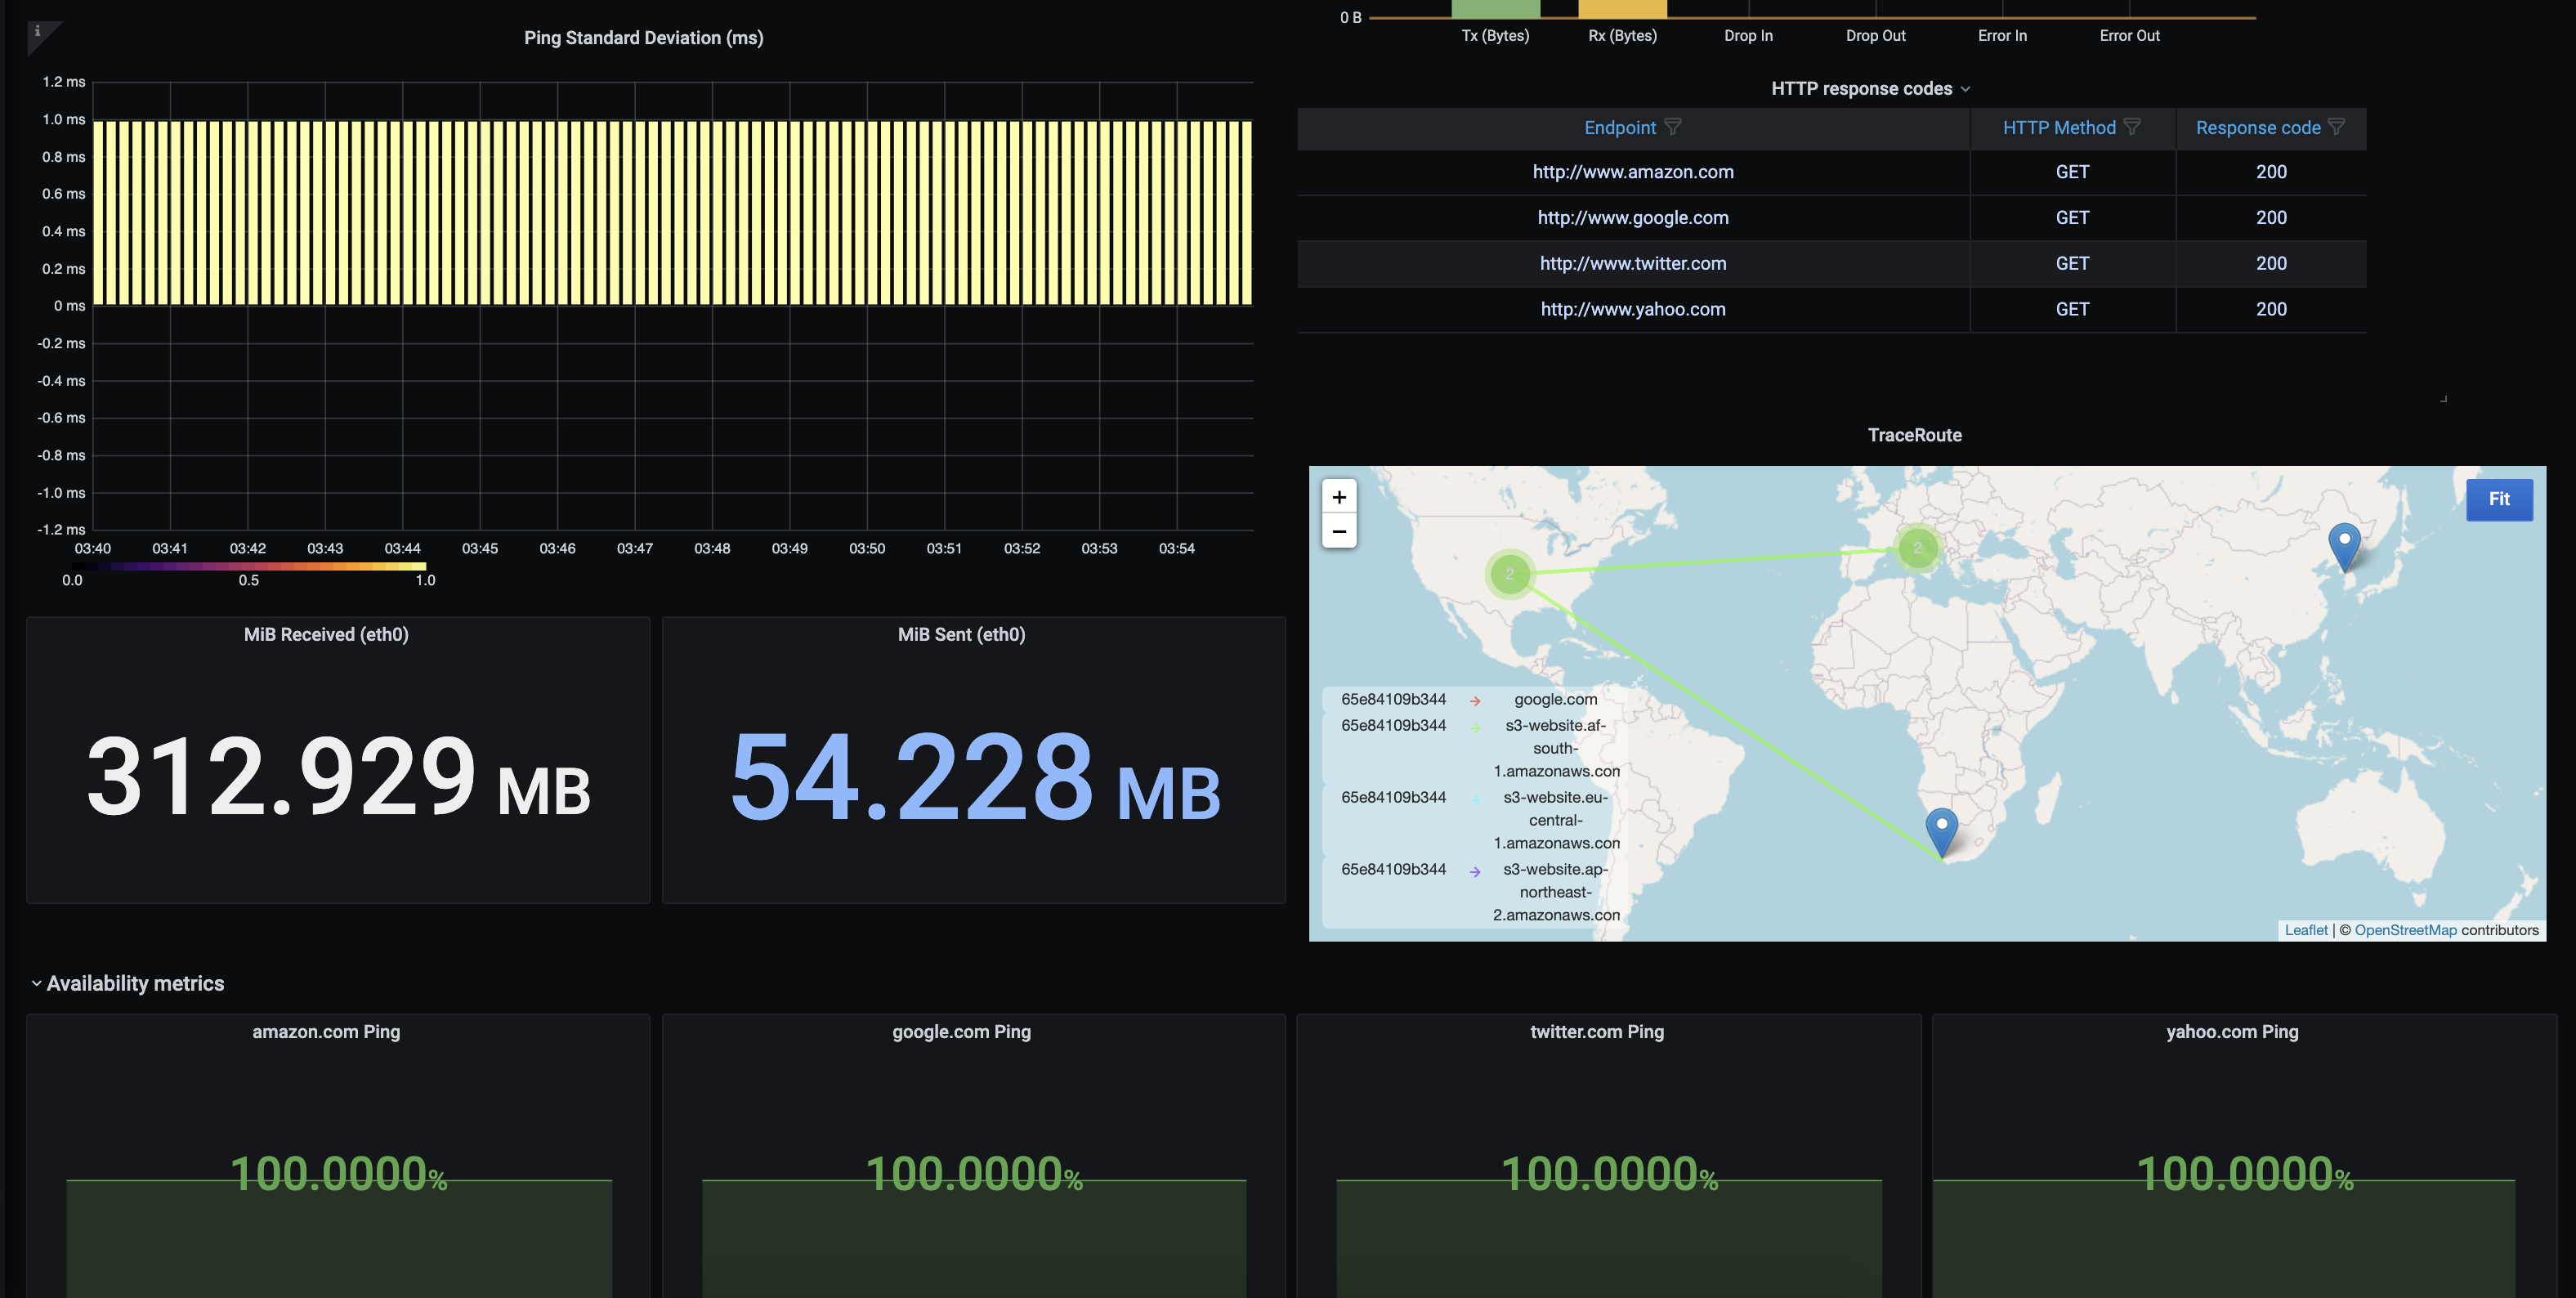
ISP-Checker implements a set of Telegraf checks that sends metrics to InfluxDB (a OpenSource, time series based database) and runs several kind of metrics collectors to get average/aggregation/integral of values at first glance and focusing on service quality.
ISP-Checker tries to test things like ICMP packet loss, the average time for DNS queries resolution, HTTP Response times, ICMP latencies, ICMP Standard Deviation, Upload/Download speed (by using Speedtest-cli) and a Graphical MTR/Traceroute version.
It's easily extensible and it was built on top of Docker to make it portable and easy to run everywhere, importing automatically all components needed to perform checks.
Feel free to reach me out for any feedback or ideas! :-)

The following platforms are supported:
linux/amd64.linux/arm/v7,linux/arm64.
You can easily import this dashboard into your current Grafana installation getting it from the Official's Grafana repository.
Kubernetes is in beta version. To install just run:
$ kubectl apply -f https://raw.githubusercontent.com/fmdlc/ISP-Checker/master/kubernetes/ISP-Checker-deploy.yamlYou need to expose the grafana service to get access. You can do it by creating a LoadBalancer service type or by using an IngressController.
Kubernetes deployment includes the @jorgedlcruz Raspberry Pi Monitoring Dashboard.
It's a super useful dashboard to monitor Hardware and Operating system stadistics and extends ISP-Checker features and contains multiples sections with the goal to monitor a full Raspberry Pi board or boards and has some sections to monitor the Linux and machine overall performance, and temperature.

For detailed Kubernetes instructions check: here.
Make sure you have the Docker-CE and cURL installed on your Raspberry Pi. If you don't, install it using your prefer method.
$ curl -fsSL https://get.docker.com -o get-docker.sh | bash -You need to have docker-compose installed. To install it execute:
$ sudo curl -L "https://github.com/docker/compose/releases/download/1.27.4/docker-compose-$(uname -s)-$(uname -m)" -o /usr/local/bin/docker-composeAlternatively you can install it using pip:
$: pip install docker-composeConfigure the ./ISP-Checker/credentials.env file.
There are two users:
- Read-Only user: Used by Grafana to acccess to metrics
- Read and Write user: Used by Telegraf to write metrics into the InfluxDB Database.
$: cat ./docker-compose/credentials.env

#--------------------------------------------------
# Setup here credentials for InfluxDB and Telegraf
#--------------------------------------------------
## InfluxDB database name
INFLUXDB_DB=telegraf

## InfluxDB admin credentials
INFLUXDB_ADMIN_USER=root
INFLUXDB_ADMIN_PASSWORD=VerySecurePassword

## Read Only user for Grafana
INFLUXDB_READ_USER=grafana
INFLUXDB_READ_USER_PASSWORD=VerySecurePassword
If your primary interface is not named eth0 please take note of the right name and update it on demand by running the following command:
$ sed -i 's/eth0/<YOUR-INTERFACE-NAME>/gi' docker-compose/grafana/network-dashboard.json
For example, if your Interface is called wlan0:
$ sed -i 's/eth0/wlan0/gi' docker-compose/grafana/network-dashboard.jsonGo to the ./ISP-Checker directory, see the Makefile on this directory.
$: make
USAGE: make <TARGET>

	- install     : Bootstrap components in docker-compose.
	- kube-install: Bootstrap components in k8s cluster.
	- start       : Start entire stack.
	- stop        : Stops entire stack.
	- restart     : Restart stack.
Execute make install to install.
$: cd ./ISP-Checker/
$: make installOpen your browser and point to http://<RASPBERRY_IP>:3000/. Login with username admin and password admin.
Change it inmediately after the first login.
Be sure you completelly understand what prune Makefile action implies (For more details check the Makefile).
To remove run make prune.
It will remove all stopped containers (yes, not only the ISP-Checker ones).
Bandwidth is the maximum rate of data transfer across a given path. Bandwidth may be characterized as network bandwidth or data bandwidth. The difference between internet speed and bandwidth can be summed in one line. Internet bandwidth is about how much data can be download or uploaded from your computer, while internet speed is how fast can the data be uploaded or downloaded on your computer.
Packet loss can be caused by a number of issues, but the most common are:
-
Network congestion, as its name suggests, occurs when a network becomes congested with traffic and hits maximum capacity. Packets must wait their turn to be delivered, but if the connection falls so far behind that it cannot store any more packets, they will simply be discarded or ignored so that the network can catch up. The good news is that today's applications are able to gracefully handle discarded packets by resending data automatically or slowing down transfer speeds.
-
Software bugs are another common cause of packet loss. If rigorous testing has not been carried out or bugs have been introduced following software updates, this could result in unintended or unexpected network behavior. Sometimes rebooting can resolve this issues, but more often than not the software will need to be updated or patched.
-
Faulty or outdated network hardware such as firewalls, network switches and routers can slow down network traffic considerably. As a company grows and starts to experience lag, packet loss and total connectivity drops, this hardware needs to be revised and updated so that it can manage the growing throughput.
Download and upload are important metrics but don't paint the entire picture of the quality of your Internet connection. Many of us find ourselves interacting with work and friends over videoconferencing software more than ever. Although speeds matter, video is also very sensitive to the latency of your Internet connection. Latency represents the time an IP packet needs to travel from your device to the service you're using on the Internet and back. High latency means that when you're talking on a video conference, it will take longer for the other party to hear your voice.
But, latency only paints half the picture. Imagine yourself in a conversation where you have some delay before you hear what the other person says. That may be annoying but after a while you get used to it. What would be even worse is if the delay differed constantly: sometimes the audio is almost in sync and sometimes it has a delay of a few seconds. You can imagine how often this would result into two people starting to talk at the same time. This is directly related to how stable your latency is and is represented by the jitter metric. Jitter is the average variation found in consecutive latency measurements. A lower number means that the latencies measured are more consistent, meaning your media streams will have the same delay throughout the session.
- Enable Network-dashboard as default dashboard.
- Allows users to select their metrics endpoint.
- Allow users to select their Grafana Org.
- Migrate services to Kubernetes.
- Helm Chart to run in Kubernetes.
- Enable HTTPS support.
- Enable Interfaces configuration.

](https://github.com/fmdlc/ISP-Checker/blob/master/img/img_4.png?raw=true](https://github.com/fmdlc/ISP-Checker/blob/master/img/img_4.png?raw=true))
Pull requests are welcome. For major changes, please open an issue first to discuss what you would like to change.
ISP-Checker is licensed under Apache 2.0 license.