Status: 🚧 Active development – interface and results may change 🚧
- Project Overview
- Key Features
- Package Requirements
- Data Sources
- Model Architecture
- Training & Evaluation
- Visualisation & Analysis
- Results
- License
- Citation
- Acknowledgements
A lightweight, end‑to‑end pipeline for generating probabilistic, multi‑horizon forecasts of state‑level COVID‑19 hospitalisations in the United States.
The code accompanies the manuscript “Integrating Spatiotemporal Features in LSTM for Spatially Informed COVID-19 Hospitalization Forecasting” (under review, 2025).
Why does it matter? Reliable hospitalisation forecasts help health‑care systems allocate resources, plan staffing, and manage surge capacity during rapidly evolving outbreaks.
- Dual‑branch SLSTM – jointly learns short‑ (7‑day) and long‑range (28‑day) temporal dependencies and fuses them with a learnable gating weight.
- Social Proximity to Hospitalisations (SPH) feature – propagates signals through the Facebook Social Connectedness Index (SCI) network to capture interstate diffusion effects.
- Quantile loss & Weighted Interval Score (WIS) – built‑in uncertainty quantification and rigorous probabilistic evaluation.
tensorflow (tf-gpu)
pandas
numpy
scikit-learn
keras| Dataset | Description | Link |
|---|---|---|
| COVID‑19 Forecast Hub | Daily state‑level hospital admissions (ground truth) | https://github.com/reichlab/covid19-forecast-hub |
| Social Connectedness Index (SCI) | Pairwise Facebook friendship intensity between US counties/states | https://dataforgood.facebook.com/dfg/tools/social-connectedness-index |
Figure 1 – Dual‑branch SLSTM with learnable fusion weight.
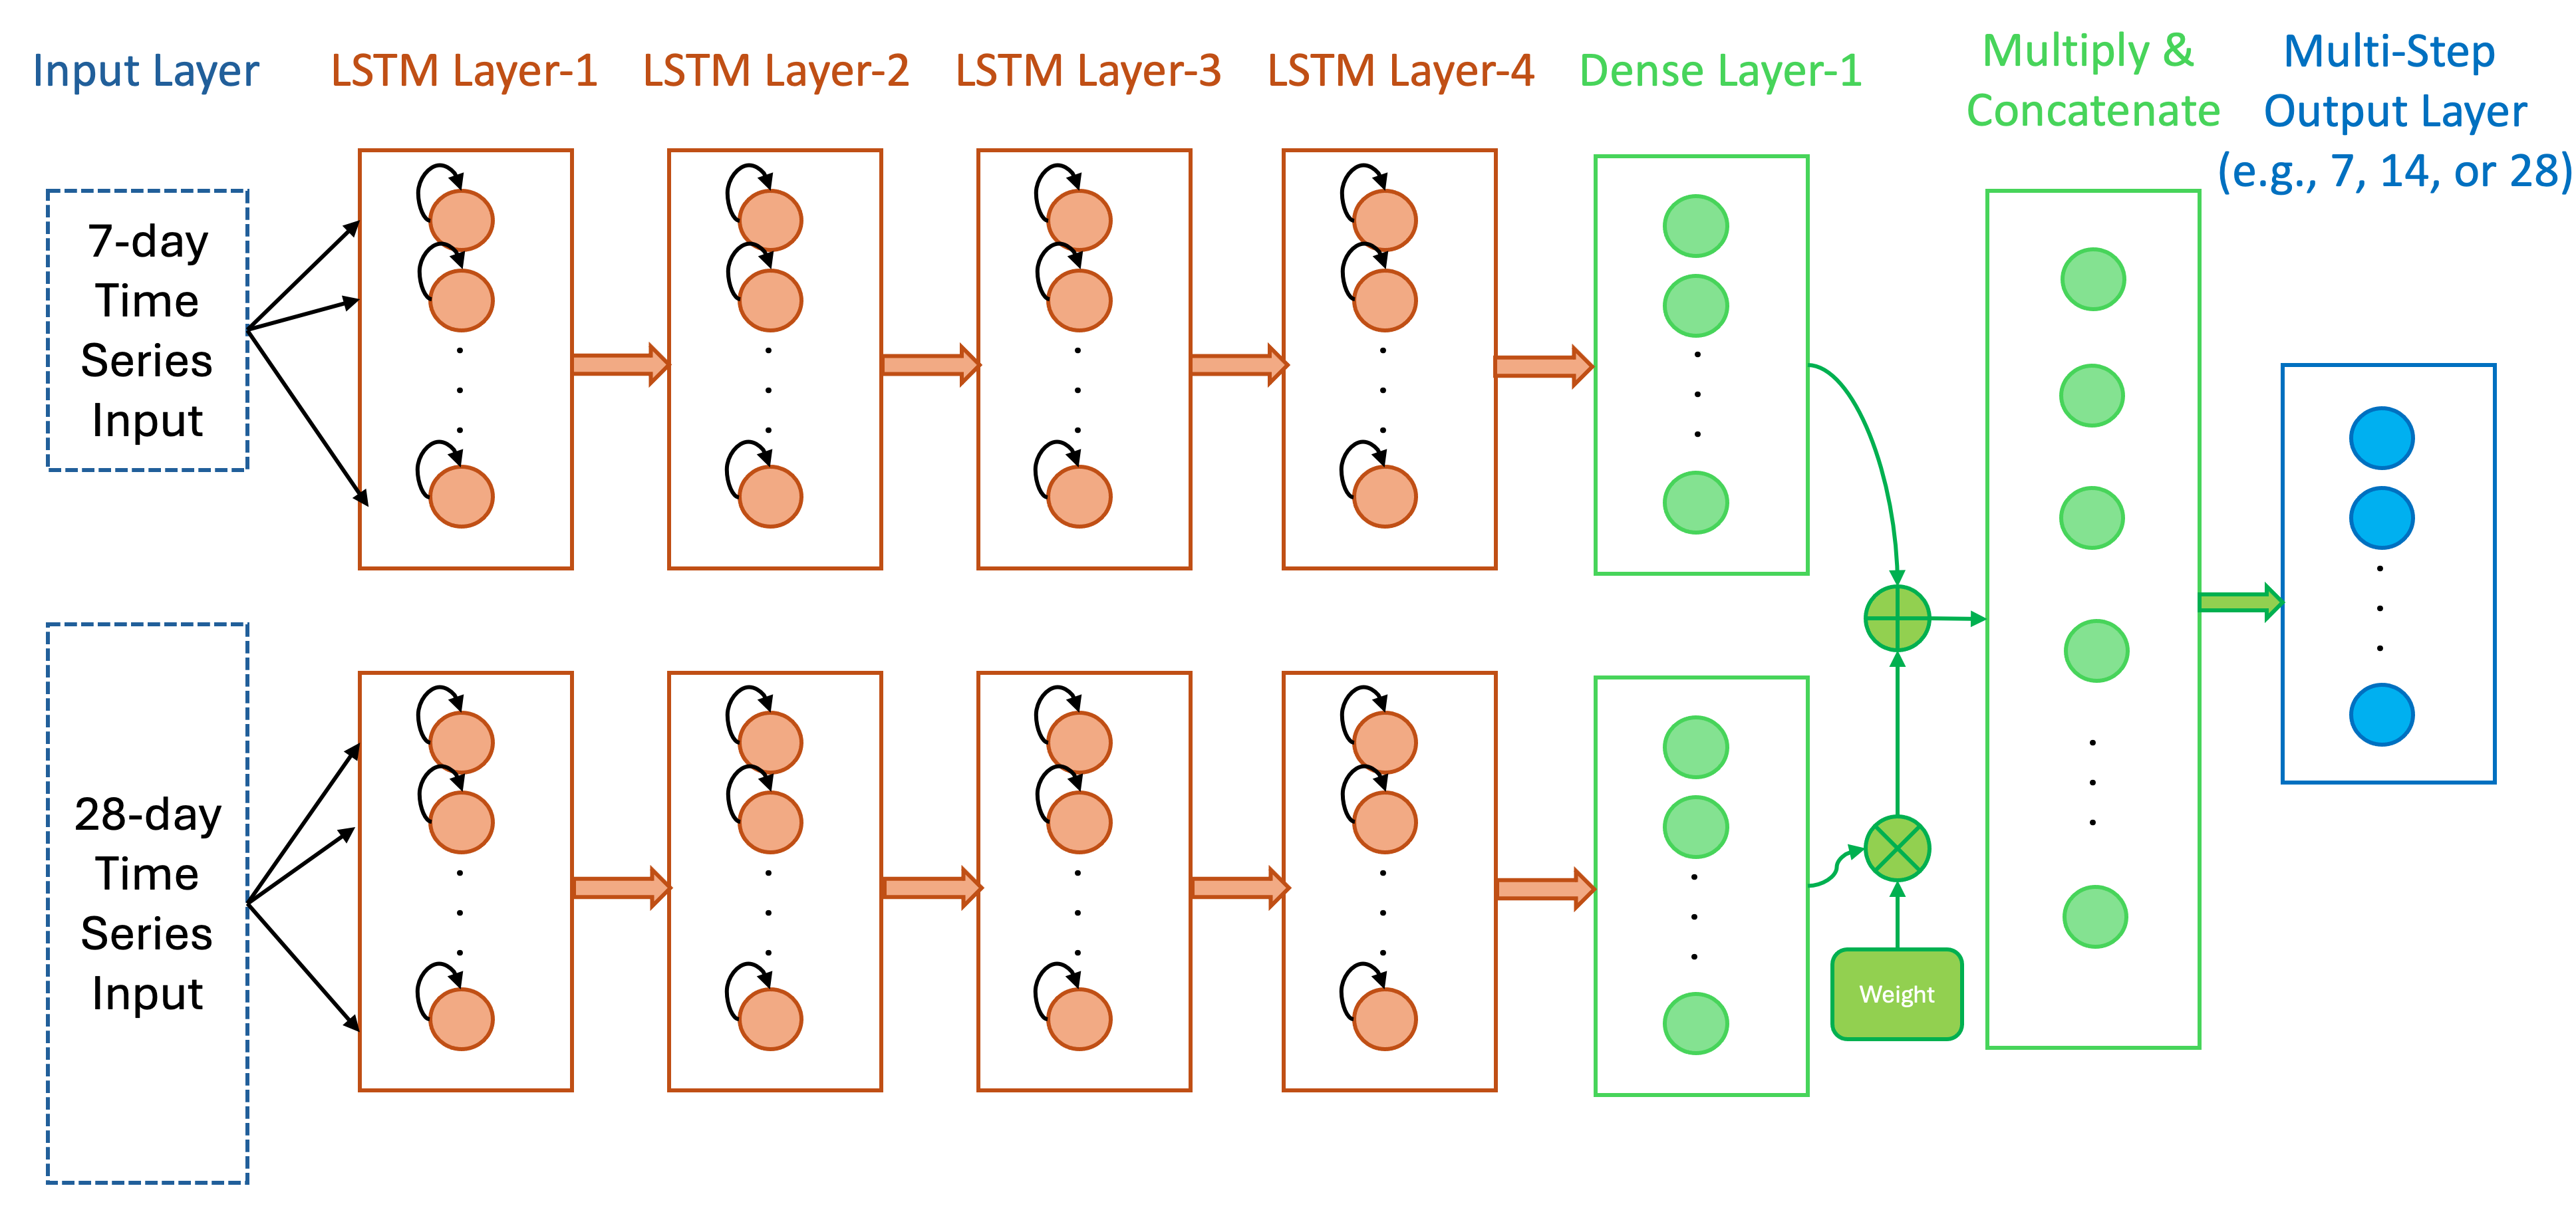
Figure 2 – Delta and Omicron evaluation windows.
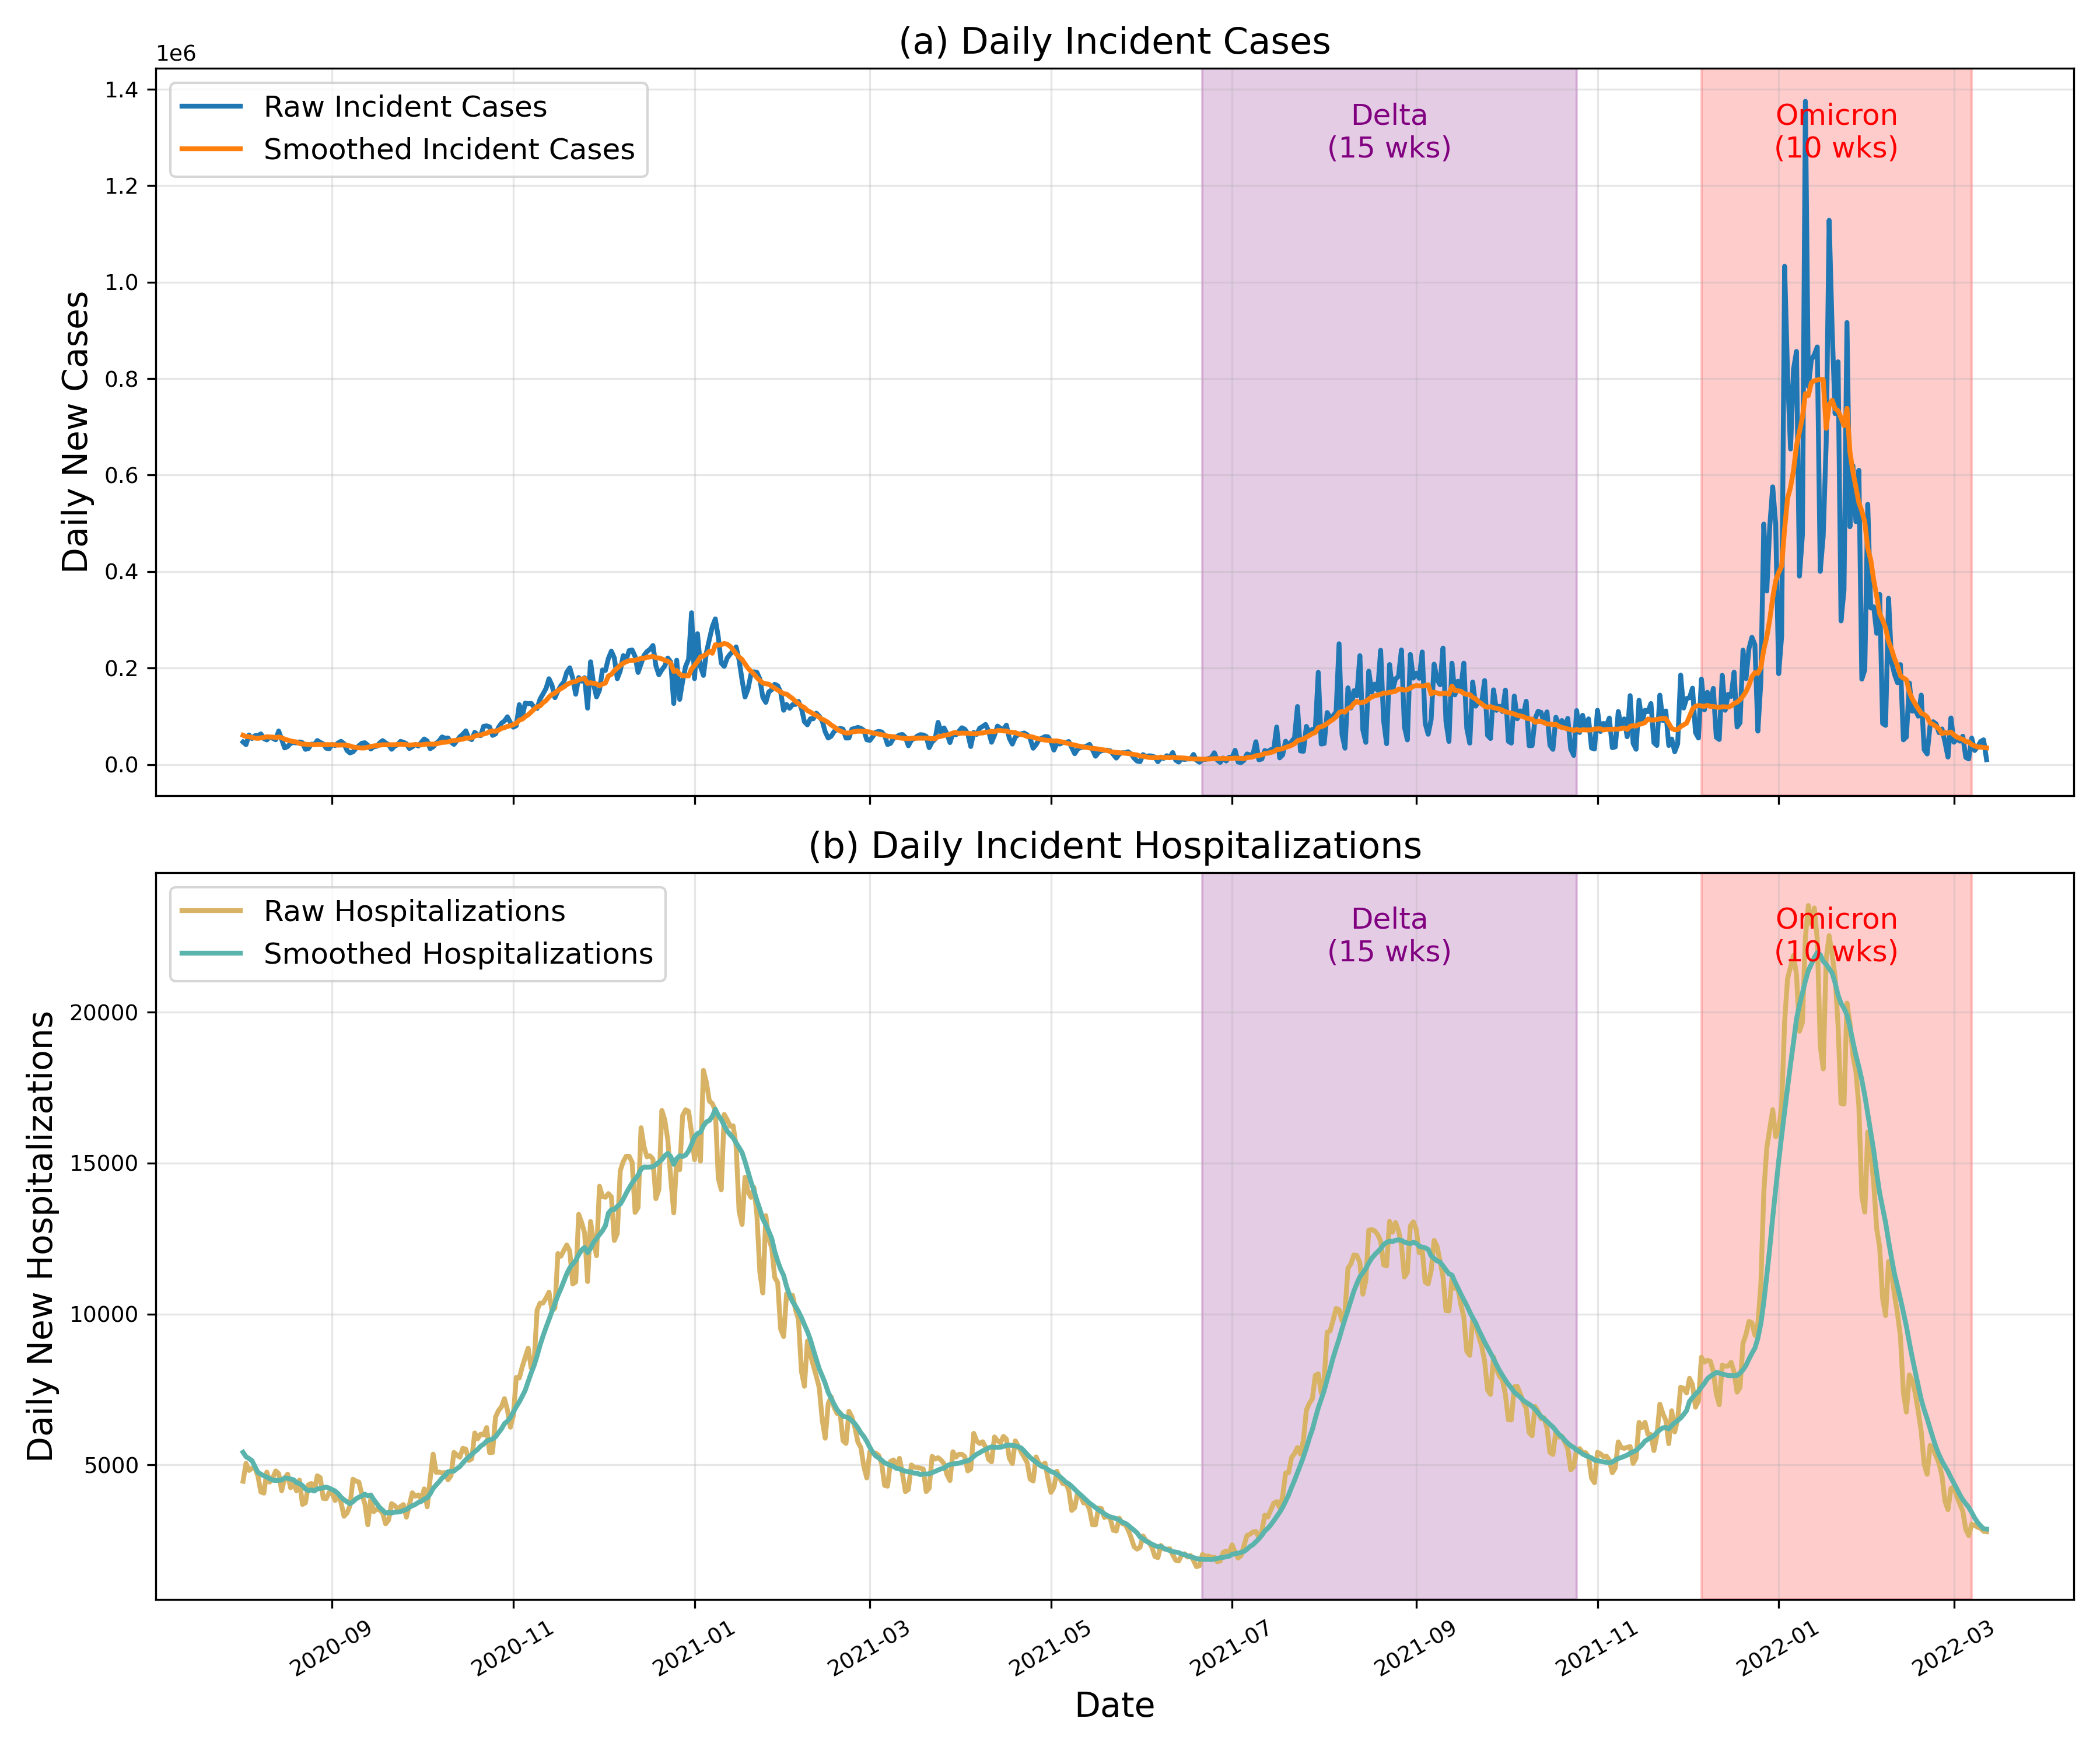
Evaluation periods: Delta wave (15 forecasts, 21 Jun – 27 Sep 2021) and Omicron wave (10 forecasts, 06 Dec 2021 – 07 Feb 2022).
Metrics: MAE, MAPE, RMSE, and WIS (with dispersion, under‑ and over‑prediction components).

| Wave | Model | MAE | MAPE | RMSE | WIS |
|---|---|---|---|---|---|
| Delta | SLSTM (+SPH) | 44.09 | 31.13 | 88.16 | 29.26 |
| COVIDhub‑baseline | 57.15 | 41.90 | 118.89 | 38.01 | |
| COVIDhub‑4wk‑ens | 50.13 | 34.15 | 105.96 | 32.96 | |
| COVIDhub‑trained‑ens | 72.45 | 43.08 | 151.56 | 48.12 | |
| Omicron | SLSTM (+SPH) | 65.70 | 26.66 | 111.66 | 45.18 |
| COVIDhub‑baseline | 132.28 | 60.97 | 227.01 | 89.14 | |
| COVIDhub‑4wk‑ens | 108.08 | 41.27 | 193.42 | 71.26 | |
| COVIDhub‑trained‑ens | 133.34 | 47.42 | 242.96 | 90.91 |
| Wave | Model | Disp | Under | Over |
|---|---|---|---|---|
| Delta | SLSTM (+SPH) | 6.88 | 13.63 | 8.75 |
| COVIDhub‑baseline | 17.42 | 12.29 | 8.30 | |
| COVIDhub‑4wk‑ens | 12.77 | 11.36 | 8.82 | |
| COVIDhub‑trained‑ens | 16.64 | 9.27 | 22.22 | |
| Omicron | SLSTM (+SPH) | 10.51 | 24.42 | 10.26 |
| COVIDhub‑baseline | 25.92 | 33.75 | 35.77 | |
| COVIDhub‑4wk‑ens | 18.91 | 24.08 | 28.80 | |
| COVIDhub‑trained‑ens | 19.96 | 27.10 | 44.42 |
Distributed under the MIT License.
The accompanying manuscript is currently under peer review.
A pre‑print DOI and BibTeX entry will be released here upon acceptance.
For now, please cite this repository directly:
Wang, Z. et al. (2025) “Integrating Spatiotemporal Features in LSTM for Spatially Informed COVID-19 Hospitalization Forecasting”, GitHub repository, https://github.com/geohai/covid-lstm-hosp.
Funding: Population Council; University of Colorado Population Center (CUPC, P2CHD066613).
We thank the COVID‑19 Forecast Hub team and Meta Data for Good for providing open data resources.