We read every piece of feedback, and take your input very seriously.
To see all available qualifiers, see our documentation.
Have a question about this project? Sign up for a free GitHub account to open an issue and contact its maintainers and the community.
By clicking “Sign up for GitHub”, you agree to our terms of service and privacy statement. We’ll occasionally send you account related emails.
Already on GitHub? Sign in to your account
Thanks to @GokulGeo for contributing the example.
# TCC Map fig = plt.figure(figsize=(15,12)) # use cartoee to get a map ax = cartoee.get_map(Sentinel_2_2,vis_params=vis_So_TCC ,region=zoom_region) # add gridlines to the map at a specified interval cartoee.add_gridlines(ax,interval=[0.015,0.015],linestyle=":") ax.set_title( label = 'Breach 2: Sentinel-2(TCC), June 22,2020', fontsize = 15 ) cartoee.add_layer(ax, Embk_paint, region=zoom_region, vis_params=vis_emb) cartoee.add_scale_bar(ax, 1, xy=(0.1, 0.02), linewidth=2, color="white", unit="km") cartoee.add_north_arrow(ax, 'N', xy=(0.95, 0.9), arrow_length=0.1, text_color="white", arrow_color="white") # add a marker for Breach ax.plot(93.649587, 26.79789,'ko',color='#A8321D') ax.text(93.649898, 26.79889,'Breach 2',color='#52FA71',fontweight='bold') legend_elements = [Line2D([], [], color='#52FA71', lw=5, label='Embankment'), Line2D([], [], marker='o', color='#A8321D', label='Breach location', markerfacecolor='#A8321D', markersize=10, ls ='')] # Create the figure ax.legend(handles=legend_elements, loc='lower right') plt.show()
The text was updated successfully, but these errors were encountered:
Added a chart module #343
1336723
Added cartoee legend #343
3901dea
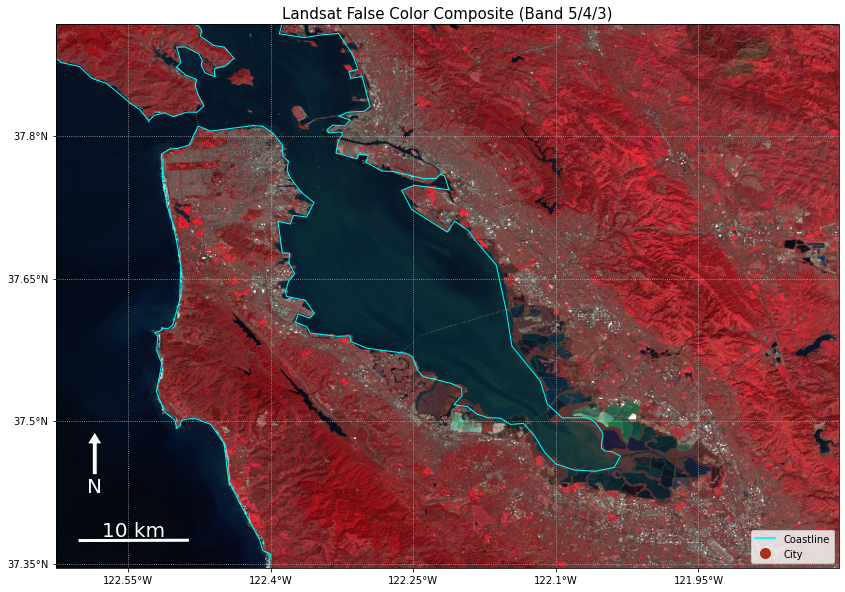
This feature has been implemented. See notebook example https://geemap.org/notebooks/66_cartoee_legend
Sorry, something went wrong.
No branches or pull requests
Thanks to @GokulGeo for contributing the example.
The text was updated successfully, but these errors were encountered: