git-lfs died of signal 9 #2439
Comments
|
@larsxschneider thanks for opening this. I think this has to do with the number of file descriptors that LFS has open at any one time. One approach that I tend to use when debugging problems like this: $ PID=$(ps aux | grep git-lfs | awk '{ print $2 }')
$ while true; do
lsof -p "$PID" | wc -l;
sleep .5;
doneor printing the diff --git a/git-lfs.go b/git-lfs.go
index c0dad72a..8812cb28 100644
--- a/git-lfs.go
+++ b/git-lfs.go
@@ -4,10 +4,13 @@ package main
import (
"fmt"
+ "io/ioutil"
"os"
"os/signal"
+ "runtime"
"sync"
"syscall"
+ "time"
"github.com/git-lfs/git-lfs/commands"
)
@@ -18,6 +21,34 @@ func main() {
var once sync.Once
+ done := make(chan struct{})
+ wg := new(sync.WaitGroup)
+ wg.Add(1)
+
+ go func() {
+ defer wg.Done()
+
+ f, err := ioutil.TempFile()
+ if err != nil {
+ return
+ }
+
+ defer f.Close()
+
+ for {
+ select {
+ case <-time.After(100 * time.Millisecond):
+ var ms runtime.MemStats
+
+ runtime.ReadMemStats(&ms)
+
+ fmt.Fprintf(f, "%+v\n", ms)
+ case <-close:
+ return
+ }
+ }
+ }()
+
go func() {
for {
sig := <-c
@@ -28,6 +59,8 @@ func main() {
if sysSig, ok := sig.(syscall.Signal); ok {
exitCode = int(sysSig)
}
+ close(done)
+ wg.Wait()
os.Exit(exitCode + 128)
}
}() |
|
@ttaylorr thanks for the hints! The number of file descriptors seems not to be the issue as no more than 59 files are open at a time. However, the memory statistics are interesting (we have 2 git-lfs processed as explained above): Git LFS process 1: Git LFS process 2: If I am reading this right then this means Git LFS allocates 96GB before it dies. Looks like a memory leak?! |
|
FYI: @pluehne @terrorobe 👆 |
Are you looking at the package runtime
type MemStats struct {
// TotalAlloc is cumulative bytes allocated for heap objects.
//
// TotalAlloc increases as heap objects are allocated, but
// unlike Alloc and HeapAlloc, it does not decrease when
// objects are freed.
TotalAlloc uint64
That all said, I don't see anything particular abnormal, other than LFS at some point during the process allocated a lot of memory (and then freed it). I would love to figure out where this is coming from, so I think it's time to start using Here's a diff to apply to LFS in order to generate a pprof report: diff --git a/git-lfs.go b/git-lfs.go
index c0dad72a..3e17e9ec 100644
--- a/git-lfs.go
+++ b/git-lfs.go
@@ -6,13 +6,24 @@ import (
"fmt"
"os"
"os/signal"
+ "runtime/pprof"
"sync"
"syscall"
+ "time"
"github.com/git-lfs/git-lfs/commands"
)
func main() {
+ f, err := os.Create(fmt.Sprintf("/dir/to/report-%s.pprof", time.Now().Unix()))
+ if err != nil {
+ panic(err.Error())
+ }
+
+ if err := pprof.WriteHeapProfile(f); err != nil {
+ panic(err.Error())
+ }
+
c := make(chan os.Signal)
signal.Notify(c, os.Interrupt, os.Kill)
@@ -28,6 +39,9 @@ func main() {
if sysSig, ok := sig.(syscall.Signal); ok {
exitCode = int(sysSig)
}
+
+ f.Close()
+
os.Exit(exitCode + 128)
}
}()You can then run Keep in mind: |
|
Please look closely at the output of Git LFS process 1. It shows 96GB heap alloc: I will try to get more info with the |
|
@ttaylorr : @pluehne and I patched the Git LFS binary according to your suggestion. We write the heap profile and exit if more than 1GB on the heap was allocated: pluehne@954c4e6 Here is the output of the pperf tool:
Unfortunately, there are only Golang core functions in the output. We did not manage Git LFS functions in there. Do you have any idea why? There are plenty of places where we use Do you have an idea which one it might be? Can you give us a hint how to debug this further? |

|
@larsxschneider thanks! Can you try running For more: https://software.intel.com/en-us/blogs/2014/05/10/debugging-performance-issues-in-go-programs. |
|
@ttaylorr I called
Hope this helps! |

|
@pluehne this is very helpful, I think I have an idea of what is going wrong. Can you apply the following diff and send me the output of stderr? diff --git a/lfs/gitscanner_catfilebatch.go b/lfs/gitscanner_catfilebatch.go
index fa785df3..5f306d9d 100644
--- a/lfs/gitscanner_catfilebatch.go
+++ b/lfs/gitscanner_catfilebatch.go
@@ -8,4 +8,5 @@ import (
"github.com/git-lfs/git-lfs/git"
+ "github.com/rubyist/tracerx"
)
@@ -130,11 +131,16 @@ func (s *PointerScanner) next(blob string) (string, string, *WrappedPointer, err
sha := sha256.New()
+ msg := "shasum"
+
var buf *bytes.Buffer
var to io.Writer = sha
if size <= blobSizeCutoff {
+ msg = msg + ", and buffer"
buf = bytes.NewBuffer(make([]byte, 0, size))
to = io.MultiWriter(to, buf)
}
+ tracerx.Printf("About to read %d bytes to %s", int64(size), msg)
+
read, err := io.CopyN(to, s.scanner.Contents(), int64(size))
if err != nil {
@@ -142,4 +148,6 @@ func (s *PointerScanner) next(blob string) (string, string, *WrappedPointer, err
}
+ tracerx.Printf("Read %d bytes to %s", int64(size), msg)
+
if int64(size) != read {
return blobSha, "", nil, fmt.Errorf("expected %d bytes, read %d bytes", size, read) |
|
@ttaylorr Thanks, I will apply the patch tomorrow and post the |
|
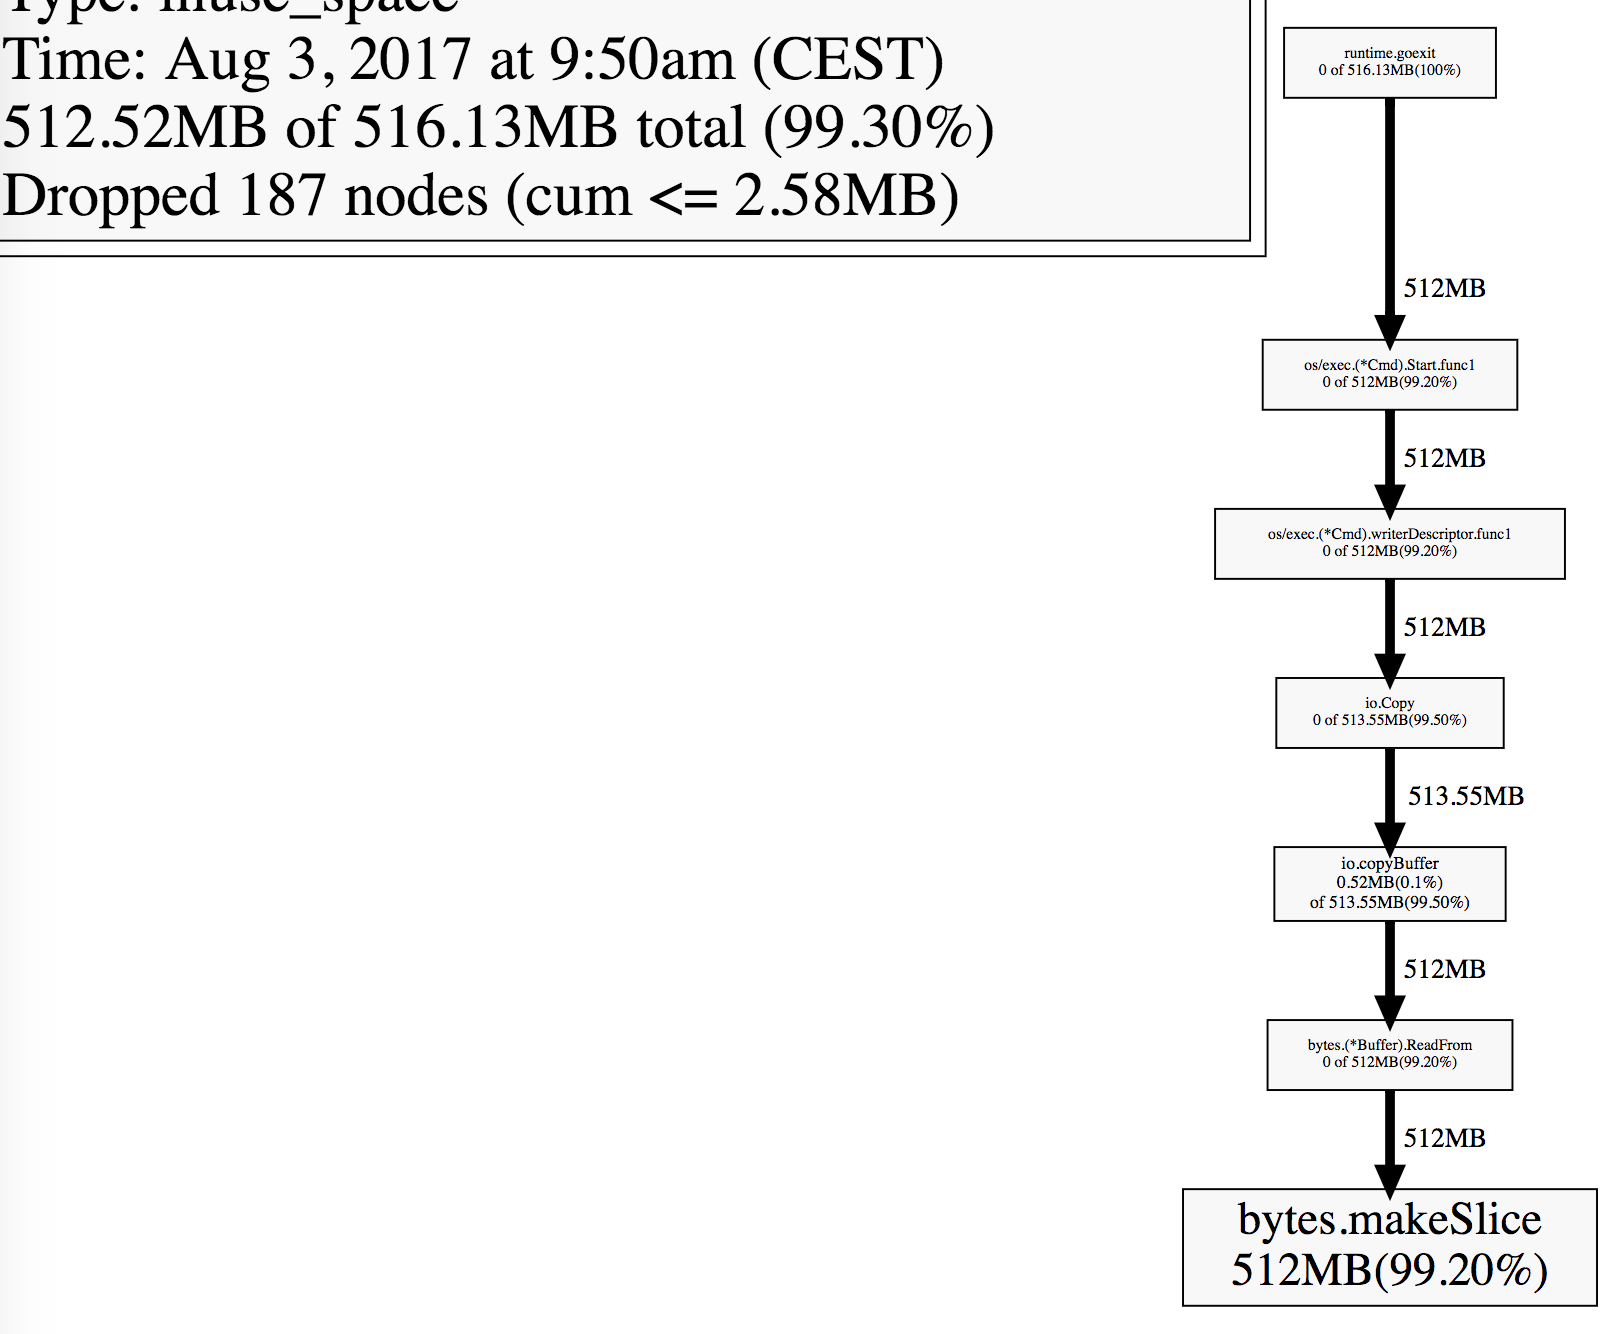
@ttaylorr Here is the |
@pluehne hm, my thought was that the calls to Does the pprof generated with |

|
I took a run at this with a handful of scenarios and couldn't reproduce, but if you're getting heap profiles showing memory leaks you can get a little more info from them with the When looking at the final memstats outputs, it's worth comparing Is there anything else particular to this repo that might help? What does the file size distribution look like [1]? Do you experience any network errors during this? Are any files symlinks? How much RAM do the machines have where this is happening? When it happens on OSX is there anything in the console log? If the kernel kills something because it's consuming all the memory you'd see a line starting with something like [1] |
|
I've used the
I can't think of anything that is special about this repo. I also was not able to generate a dummy repo to replicate the issues, too.
We are investigating network issues (see #2314) - this might be related.
No.
The Linux box has 12GB and the Mac 16GB RAM. We can reproduce it reliably on both systems.
I think it is correct that the kernel kills this process as it is allocating lots and lots of memory. go pprof outputIs this useful to you? |
|
I rerun the test and stopped the |
|
@larsxschneider thanks for the detailed response. It seems like the issue might either be in:
Can you |
|
Hmm.. both don't look like the cluprit: You can download the binary and the pprof dump here. The binary was build from this hash (with a minor modification, I changed this check to 5GB) |
|
@ttaylorr I've tested the issue with the latest master and I see this error now: Line 80 in 39c7bf6 Look at my |
|
@larsxschneider: very interesting. Let's see if we can figure out what arguments are being passed to those Git processes, and perhaps that will point us in the direction of where things are going wrong. Could you try: xargs -0 < /proc/<pid>/cmdlineassuming that you are running this on a Linux box? EDIT: |
If I clone a large Git LFS repo (~1GB native Git objects + ~30GB LFS objects) like this:
Then I can reliably reproduce the following error:
Setup
Observations
git lfs clonecalls internallygitwhich in turn calls internallygit lfs. I thinkgitprints the error message here. This is the output in the process view:git-lfsexcessively allocates system resources. I monitored the resource consumption withps auxand recorded the high CPU usage right before the process died:lfs.concurrenttransfers=1andlfs.transfer.maxretries=0then I can still reliably reproduce the errorDo you have a clue what that error might be? How would you continue with the debugging? I think it would make sense to add additional debug output (I am already running it with
GIT_TRACE=1 GIT_CURL_VERBOSE=1 GIT_TRACE_PACKET=1). Can you recommend good places for debug output?Thanks,
Lars
The text was updated successfully, but these errors were encountered: